Key Takeaways
- 282 industrial units now under GEI Target Rules 2025 with mandatory asset-level emissions tracking, compliance deadline FY 2025-26 already underway
- Energy Conservation Rules 2025 grant BEE enforcement powers with SERC-adjudicated penalties for non-compliance
- GEI overperformers earn tradable carbon credits worth ₹1,000-₹1,500 per tonne; underperformers pay 2x market price penalties
- Real-time monitoring cuts compliance reporting from 3 weeks to 2 hours while identifying 20-30% operational savings opportunities
- ISO 50001 now customer requirement for manufacturing exporters,requires 34-month energy baseline and asset-level metering
- PAT Cycle I generated ₹9,500 crore savings and ₹100 crore in ESCert trading for early adopters who treated compliance strategically
In Harvard University’s marine biology lab, researchers observed something remarkable: a mother octopus methodically examining her eggs, touching each one with her sucker cups. Some eggs she carefully tended. Others she discarded immediately.
The octopus wasn’t using sight or smell. She was tasting bacteria. Receptors in her sucker cups detected foul flavors from microbes in spoiled eggs,sending electrical signals to her brain the instant they contacted bacterial chemicals. Without training or conscious thought, she identified problems invisible to the naked eye and acted immediately.
Meanwhile, in manufacturing facilities across India, compliance officers are examining their own “eggs”,spreadsheets from FY 2023-24, hoping the data isn’t spoiled. In August 2025, three regulatory notifications arrived simultaneously: Energy Conservation Rules 2025, GEI Target Rules 2025, and PAT Cycle VII deadlines. Each requires asset-level, timestamped, auditable data.
The problem? FY 2023-24 was your baseline year,and it closed in March 2024, seven months before the GEI rules were even notified. Unlike that octopus with her bacteria-detecting sensors, most facilities have no sensors at all. They’re reconstructing baselines from shift logs, energy bills, and incomplete SCADA exports, hoping third-party auditors accept what they find.
But here’s what the facilities scrambling with spreadsheets are missing: that octopus wasn’t just avoiding spoiled eggs. She was protecting the entire batch from contamination. Similarly, the manufacturers who deployed real-time monitoring before the baseline year aren’t just achieving compliance,they’re positioned to earn ₹2-3 crore annually in tradable carbon credits while competitors pay penalties.
The era of treating compliance as a quarterly panic is over. The manufacturers recognizing this are turning mandatory asset tracking into the most profitable infrastructure they’ve ever deployed.
Three Regulations, One Deadline, Zero Room for Error
August 2025 brought a compliance trifecta that fundamentally changed Indian manufacturing.
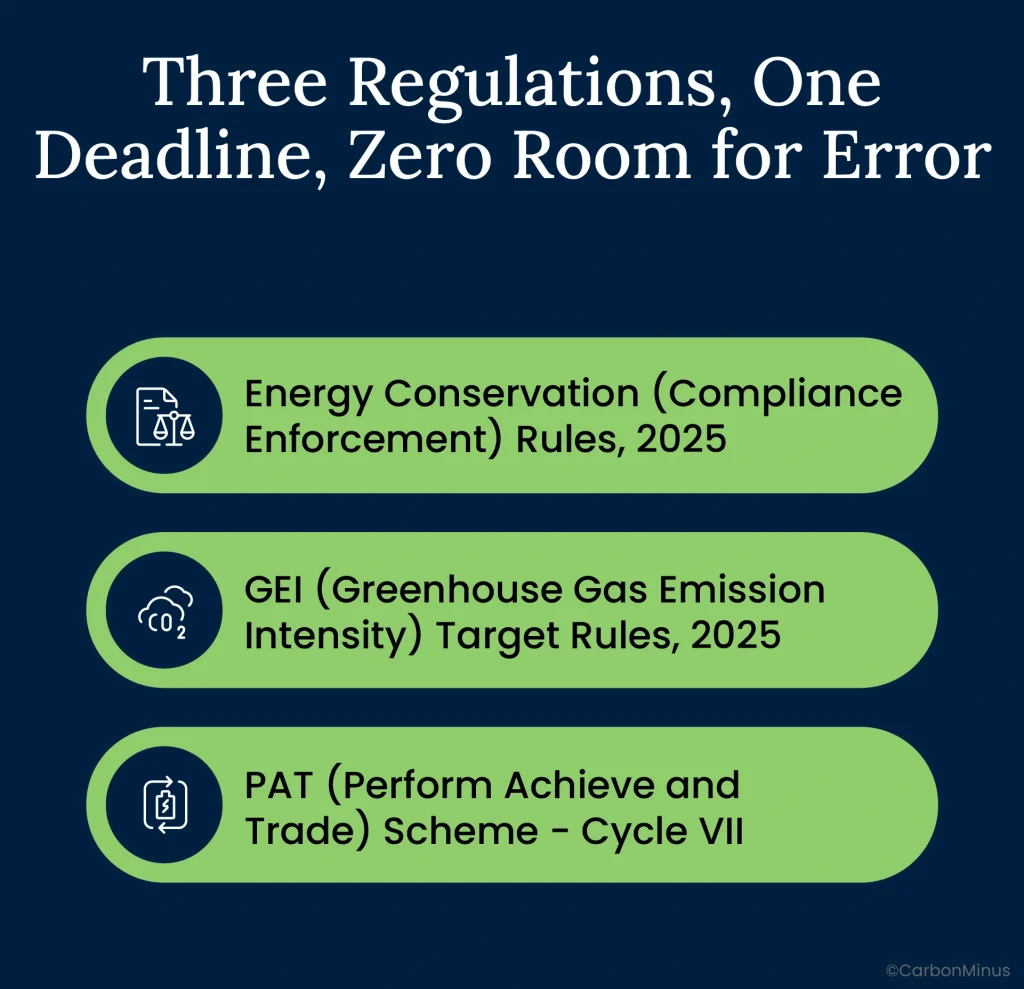
Energy Conservation (Compliance Enforcement) Rules, 2025
Notified under the Energy Conservation Act 2001, these rules represent India’s first legally binding energy efficiency enforcement mechanism. The Bureau of Energy Efficiency (BEE) is now empowered to detect, verify, and report non-compliance. State Electricity Regulatory Commissions (SERCs) adjudicate penalties.
What it mandates:
- Detailed asset tracking for all designated consumers under the Energy Conservation Act
- Energy consumption returns filed annually with verifiable data trails
- Compliance with energy efficiency standards for energy-intensive industries and specified appliance importers
- BEE inspection authority with legal enforcement power
The shift from voluntary guidelines to enforceable penalties changes everything. Non-compliance is no longer a matter of “we’ll improve next year”,it triggers formal adjudication and financial consequences.
GEI (Greenhouse Gas Emission Intensity) Target Rules, 2025
This is India’s first legally binding emission reduction mandate. Notified by the Ministry of Environment, Forest and Climate Change in October 2025, it covers 282 industrial units across four sectors:
- Aluminium: 13 units, baseline average 12.5 tCO₂e per tonne aluminium
- Cement: 247 units (largest group), baseline average 0.62 tCO₂e per tonne cement
- Chlor-alkali: 11 units, baseline average 1.25 tCO₂e per tonne caustic soda
- Pulp & Paper: 11 units, baseline average 1.15 tCO₂e per tonne paper
The compliance structure:
- Baseline year: FY 2023-24 (closed March 31, 2024)
- Compliance period: FY 2025-26 and FY 2026-27
- Measurement: tCO₂e per tonne of product output (emissions intensity, not absolute emissions)
- Scope: Scope 1 + Scope 2 + relevant Scope 3 emissions
- GWP weighting: All greenhouse gases (CO₂, CH₄, N₂O) weighted by Global Warming Potential
- Verification: Third-party MRV (Measurement, Reporting, Verification) anticipated
The enforcement mechanism:
- Overperformers: Earn tradable carbon credit certificates from BEE
- Underperformers: Must buy credits from Carbon Credit Trading Scheme (CCTS) or pay 2x market price penalty to government
- Target reductions: 2-3% average emissions intensity reduction for FY 2025-26
PAT (Perform Achieve and Trade) Scheme – Cycle VII
While GEI and Energy Conservation Rules are new, PAT is a proven mechanism now in its seventh cycle with refined enforcement:
Current status:
- 509 Designated Consumers in PAT Cycle VII
- Mandatory energy audits every 3 years by BEE-accredited auditors
- Specific Energy Consumption (SEC) tracking per production unit (e.g., kWh per tonne of steel)
- Energy Saving Certificates (ESCerts) tradable on Indian Energy Exchange
- Each ESCert represents 1 MWh of energy saved
Historic performance proves the model works:
- PAT Cycle I achieved 8.67 MTOE (million tonnes of oil equivalent) energy saved,30% above target
- ₹9,500 crore in monetary savings across participating facilities
- 31 million tonnes CO₂e avoided
- 38.5 lakh ESCerts issued to overperformers
- ₹100 crore total trading volume on Indian Energy Exchange
The Convergence That Changes Everything
While these three regulations come from different ministries with different objectives, they share one critical requirement: granular, asset-level, timestamped, auditable data.
GEI needs emissions intensity per tonne of product. PAT needs SEC tracking per production unit. ISO 50001 (now a customer requirement) needs EnPI monitoring with 34-month baselines. Energy Conservation Rules need comprehensive asset inventories.
The data foundation is identical. Only the reporting formats differ. This convergence creates both crisis and opportunity.
From Facility Aggregates to Equipment Forensics
For decades, Indian energy compliance followed a predictable rhythm.
The Old Compliance Playbook
Every three years, a BEE-accredited energy auditor would arrive at your facility. Your team would spend three weeks compiling data:
- Energy bills showing total kWh per month (facility-level aggregates, no equipment breakdown)
- Production records from shift logs (often incomplete or inconsistent)
- Maintenance logs (if they existed in digital form)
- SCADA data exports (for facilities with modern systems)
- Manual calculations reconstructing energy consumption by major department
The auditor would identify 20-30% savings opportunities through walk-through observations and calculations. Your facility would receive a comprehensive report with recommendations. That report would be filed, submitted to BEE for compliance, and largely forgotten until the next audit cycle.
Time investment: Three weeks of staff time per audit
Value extracted: Compliance checkbox only
Findings implemented: Typically less than 10%
This approach worked when compliance was voluntary and energy costs were stable. Neither condition exists in 2025.
What the New Regulations Actually Demand
GEI Target Rules require:
- Asset-level emissions intensity: Not just facility total, but tCO₂e per tonne per equipment category (kilns, mills, compressors, furnaces)
- Timestamped production outputs linked to emissions by batch or shift
- Scope 1 + Scope 2 + Scope 3 tracking: Direct emissions, purchased energy, and relevant supply chain emissions
- Global Warming Potential weighting: All GHGs (CO₂, CH₄, N₂O) converted to CO₂ equivalents using IPCC factors
- Audit-proof data trail: Third-party MRV (Measurement, Reporting, Verification) expected to follow CPCB verification standards
- Real-time performance tracking: Not annual calculations, but continuous monitoring to verify overperformance claims
ISO 50001 requires (now mandatory for export customers):
- 34-month energy baseline minimum for statistical validity,capturing seasonal variations, production mix changes, and eliminating anomalies
- Asset-level metering for high-emission equipment categories
- EnPI (Energy Performance Indicators) tracked continuously with automated alerts when performance degrades
- Life cycle cost calculation mandatory for all energy-consuming equipment procurement decisions
- Operational control measures with batch/shift-level KPI monitoring and documented corrective actions
PAT Scheme requires:
- Specific Energy Consumption (SEC) tracking per unit output (not facility aggregates)
- Normalized for production variables: Product mix, ambient conditions, raw material quality
- Verifiable energy consumption data meeting BEE auditor standards for each Designated Consumer
- Annual returns with supporting documentation for ESCert eligibility
The common thread: You can’t meet these requirements with annual audits and spreadsheet compilation.
The Timing Crisis Nobody Anticipated
Here’s where most facilities discovered they had a problem:
October 2025: GEI Target Rules notified
FY 2023-24: Declared baseline year
March 31, 2024: Baseline year closed,seven months before rules were notified
Most facilities did not track asset-level emissions data in FY 2023-24 because the requirement didn’t exist yet. Now they must reconstruct that baseline retroactively from whatever sources they can find:
- Shift logs (often incomplete, handwritten, inconsistent)
- Energy bills (facility-level only, no asset breakdown)
- SCADA historical exports (if systems existed and data was archived)
- Production records (requiring emissions calculations based on assumptions)
The challenge: Third-party MRV auditors require verifiable, traceable, timestamped data. Reconstructed baselines with gaps and assumptions may achieve minimum compliance (avoiding penalties) but won’t prove overperformance (earning carbon credits).
60% of facilities are struggling with this exact problem. The compliance year FY 2025-26 is already half over for plants notified mid-year. The window for capturing first-cycle carbon credit revenue is narrowing daily.
Two Plants, Same Regulations, Opposite Outcomes
The difference between compliance as burden and compliance as goldmine comes down to infrastructure and mindset.
Plant A: The Compliance Trap
Scenario: Cement manufacturer in Gujarat, 1.2 million tonne annual capacity, under GEI Target Rules + PAT Cycle VII + pursuing ISO 50001 for export contracts
The Approach:
- Three weeks before each audit deadline, hire BEE-accredited consultant
- Pull team from operations to manually compile data from 47 different spreadsheets
- Reconstruct FY 2023-24 baseline from energy bills, shift logs, production records
- Calculate GEI intensity using assumed emission factors and estimated equipment contributions
- Submit minimum required documentation hoping third-party auditor accepts it
- Pass audit with qualification notes about data gaps
The Outcome:
- 3 weeks of staff time consumed every reporting cycle (4 cycles annually = 12 weeks)
- Zero operational insights extracted from compliance data,reports filed and forgotten
- 20-30% energy savings opportunities identified in energy audit but never acted upon
- No carbon credit eligibility,can’t prove GEI overperformance with manual, assumption-based tracking
- ISO 50001 certification delayed indefinitely,inadequate baseline data for EnMS requirements
- Next audit in 6 months: Exact same nightmare repeats
Total Cost Over 3 Years:
- Compliance reporting labor: ₹40 lakhs (36 weeks × ₹1.1 lakhs per week loaded cost)
- Missed operational savings: ₹15 crore (20% of ₹50 crore annual energy spend × 3 years)
- Foregone carbon credits: ₹6-9 crore (₹2-3 crore annually × 3 years)
- Lost export contracts: ₹20 crore (ISO 50001 delay costs key customer)
- Total opportunity cost: ₹41+ crore
Compliance becomes an expense center that delivers nothing beyond avoiding penalties.
Plant B: The Asset Goldmine
Scenario: Automotive component manufacturer in Pune, under ISO 50001 requirement from European customers, proactively deployed monitoring in FY 2022-23
The Approach:
- Real-time energy monitoring deployed 18 months before baseline year
- 1,000 IoT sensors across facility tracking compressors, chillers, lighting, HVAC, production equipment
- Automated data collection: Timestamped, traceable, integrated with existing SCADA systems
- 34-month energy baseline established automatically without manual compilation
- Continuous compliance tracking: GEI, PAT, ISO 50001 calculated from single data source
- Proactive optimization: Operations team acts on insights in real-time, not quarterly
The Outcome:
- 2-hour report generation vs. 3-week manual process,98% time reduction
- ISO 50001 certified with complete, auditor-approved 34-month baseline
- 163,320 kWh annual waste eliminated from compressed air system alone
- 15-20% overall energy reduction achieved across facility
- Reduced equipment failures via condition-based maintenance using consumption patterns
- Customer requirement satisfied: ISO 50001 now contract prerequisite with European OEMs
- GEI overperformance documented: Positioned for carbon credit eligibility if rules extended to automotive
Total Value Over 3 Years:
- Compliance automation savings: ₹38 lakhs (freed 34 weeks of staff time)
- Operational savings: ₹22.5 crore (15% of ₹50 crore energy spend × 3 years)
- Preserved export contracts: ₹120 crore (ISO 50001 enabled contract renewals)
- Total value creation: ₹142+ crore
Infrastructure investment: ₹65 lakhs (1,000 sensors + platform + integration)
Net ROI: 218x over 3 years
Payback period: 5 months
Compliance infrastructure becomes the highest-ROI operational investment the facility ever made.
What Separates Them
The difference isn’t budget, facility age, or technical sophistication. It’s how compliance is framed:
Plant A mindset:
- Compliance = regulatory burden to minimize
- Audits = one-time exercises to pass
- Data collection = separate from operations
- Expense to endure
Plant B mindset:
- Compliance = strategic infrastructure investment
- Audits = validation of continuous operational improvement
- Data integration = energy + emissions + maintenance unified
- Value creation engine generating multiple ROI streams
The infrastructure difference is real-time, asset-level monitoring vs. annual audits and manual spreadsheets.
The mindset difference determines whether that infrastructure gets deployed at all.
From GEI Compliance to ₹2-3 Crore Annual Revenue
Here’s the goldmine most compliance officers don’t even know exists.
How GEI Rules Create Financial Upside
The GEI Target Rules aren’t just penalties for non-compliance,they’re a market-driven incentive system creating tradable financial instruments from emissions reductions.
The mechanism:
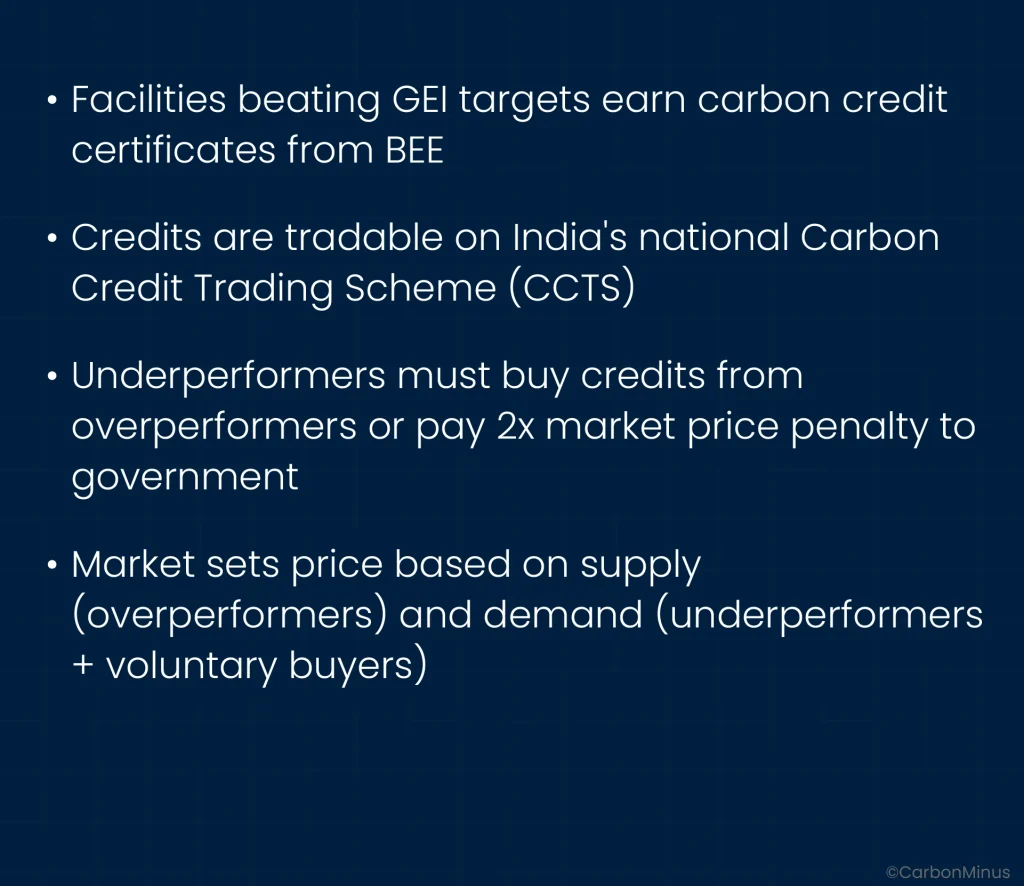
This creates a powerful dynamic: efficiency becomes revenue, not just cost avoidance.
The Math That Changes Boardroom Conversations
Let’s calculate the carbon credit opportunity for a typical cement plant:
Plant Parameters:
- Production capacity: 1 million tonnes cement annually
- Baseline intensity (FY 2023-24): 0.62 tCO₂e per tonne cement
- GEI target (FY 2025-26): 2.5% reduction = 0.605 tCO₂e per tonne
- Achieved intensity: 0.589 tCO₂e per tonne (5% reduction,2.5% overperformance)
Credit Calculation:
- Target intensity: 0.605 tCO₂e/tonne
- Achieved intensity: 0.589 tCO₂e/tonne
- Overperformance: 0.016 tCO₂e/tonne (2.6% beyond target)
- Annual production: 1,000,000 tonnes
- Total overperformance: 16,000 tonnes CO₂e annually
Revenue Projection:
- Estimated carbon credit price: ₹1,000-₹1,500 per tonne CO₂e
- Based on international carbon markets and PAT ESCert trading history (₹100 crore total trading in Cycle I)
- Annual credit value: ₹1.6-2.4 crore
Over compliance period (FY 2025-26 and FY 2026-27):
- Total credit potential: ₹3.2-4.8 crore over 2-year cycle
For plants with higher production volumes or greater overperformance, the numbers scale proportionally. A 2-million-tonne facility achieving 5% overperformance: ₹3.2-4.8 crore annually.
The Critical Requirement Nobody Mentions
Here’s the catch that eliminates most facilities from earning these credits: You must prove overperformance with verifiable, auditable, timestamped data.
Manual tracking and reconstructed baselines won’t suffice. Third-party MRV auditors will require:
- Real-time emissions monitoring by equipment category
- Timestamped production outputs linked to emissions
- Traceable data trail from source (meters) to reporting (CPCB formats)
- Continuous measurement, not quarterly calculations
Plants with manual compliance can achieve minimum compliance (avoid penalties). They cannot prove overperformance (earn credits).
This is why Plant A from the previous example, despite potentially achieving better-than-target performance, earns zero carbon credits. They can’t prove it to auditor standards.
Who Wins, Who Loses
Winners (first-mover advantage):
- Facilities with real-time monitoring operational before baseline year (FY 2023-24)
- Plants with energy management culture already embedded in operations
- Manufacturers in sectors with tighter targets (higher credit scarcity = higher market value)
- Companies that can demonstrate verifiable reductions with audit-proof data trails
Losers (caught unprepared):
- Plants without FY 2023-24 baseline data can’t prove overperformance retroactively
- Facilities relying on manual tracking,insufficient audit trail for credit certification
- Manufacturers notified mid-compliance year,already behind on FY 2025-26 targets
- Companies treating GEI as checkbox compliance,miss entire revenue opportunity
The urgency: FY 2025-26 is the first compliance cycle. Plants without monitoring systems deployed NOW will miss this cycle entirely. Next cycle (FY 2026-27) requires establishing a new baseline,meaning you need 12+ months of data before that cycle begins.
The window for first-cycle carbon credit revenue is closing faster than most compliance officers realize.
Five Revenue Streams From One Compliance Infrastructure
Carbon credits are just the beginning. Properly designed compliance infrastructure creates five distinct revenue streams.
Revenue Stream 1: Operational Savings (₹5-15 Crore Annually)
Real-time monitoring delivers 20-30% energy cost reduction compared to 5% from manual audits. For a plant spending ₹50 crore annually on energy, that translates to ₹10-15 crore in annual savings.
The Pune automotive case provides concrete proof: 163,320 kWh eliminated from compressed air system alone, plus 15-20% overall reduction. Savings compound annually,unlike one-time cost reductions, energy efficiency delivers recurring financial benefits.
Revenue Stream 2: Carbon Credit Trading (₹2-3 Crore Annually)
GEI overperformance generates tradable credits as calculated above. PAT ESCerts from absolute energy savings create a second credit stream. Dual credit eligibility: emissions intensity + absolute energy reduction.
Market liquidity is improving with CCTS launch, creating more buyers and transparent pricing.
Revenue Stream 3: ESG-Linked Financing (Cost of Capital Reduction)
Companies with higher ESG scores access capital 50-75 basis points cheaper than peers. 75% of institutional investors prioritize ESG metrics in investment decisions. Verified emissions data,the kind compliance infrastructure generates,enables lower cost of capital.
For a ₹500 crore facility seeking refinancing, 50 basis points = ₹2.5 crore annual interest savings. Green bonds and sustainability-linked loans require auditable intensity metrics that real-time monitoring provides automatically.
Revenue Stream 4: Customer Premiums & Market Access (₹20-200 Crore Contract Value)
ISO 50001 is now a customer requirement for manufacturing exporters, particularly to European markets. The Pune automotive facility’s experience is instructive: ISO 50001 certification became contract prerequisite. Without it, ₹50-200 crore annual export contracts were at risk.
CBAM (Carbon Border Adjustment Mechanism) compliance for EU exports requires verified product carbon footprints,exactly what asset-level monitoring generates. Supply chain transparency differentiates in B2B contracts where sustainability commitments matter.
Revenue Stream 5: Asset Lifecycle Optimization (₹3-8 Crore Over 3 Years)
Energy-efficient operations extend equipment lifespan by 40% while reducing maintenance costs. Predictive maintenance enabled by consumption pattern monitoring reduces emergency repairs by 70-75%.
Deferred capex from optimal replacement timing (not premature or too-late replacement) preserves capital for higher-return investments. Well-maintained assets command premium resale values.
The Total Value Stack
For a ₹50 crore annual energy spend facility over 3 years:
| Revenue Stream | Annual Value | 3-Year Value |
| Operational Savings (20%) | ₹10 crore | ₹30 crore |
| Carbon Credits (GEI + PAT) | ₹2-3 crore | ₹6-9 crore |
| ESG Financing (50 bps on ₹500 crore) | ₹2.5 crore | ₹7.5 crore |
| Market Access (contract preservation) | ₹20 crore | ₹60 crore |
| Asset Optimization | ₹2.5 crore | ₹7.5 crore |
| Total Value Creation | ₹37-38 crore | ₹111-114 crore |
Infrastructure investment: ₹40-80 lakhs depending on facility size
Net ROI: 139-285x over 3 years
Payback: 6-10 months
Compare this to checkbox compliance (Plant A): ₹0 value creation, ₹41 crore opportunity cost.
From Compliance Crisis to Strategic Asset Management: Your 90-Day Roadmap
The gap between panic and position isn’t years,it’s 90 days of focused action.
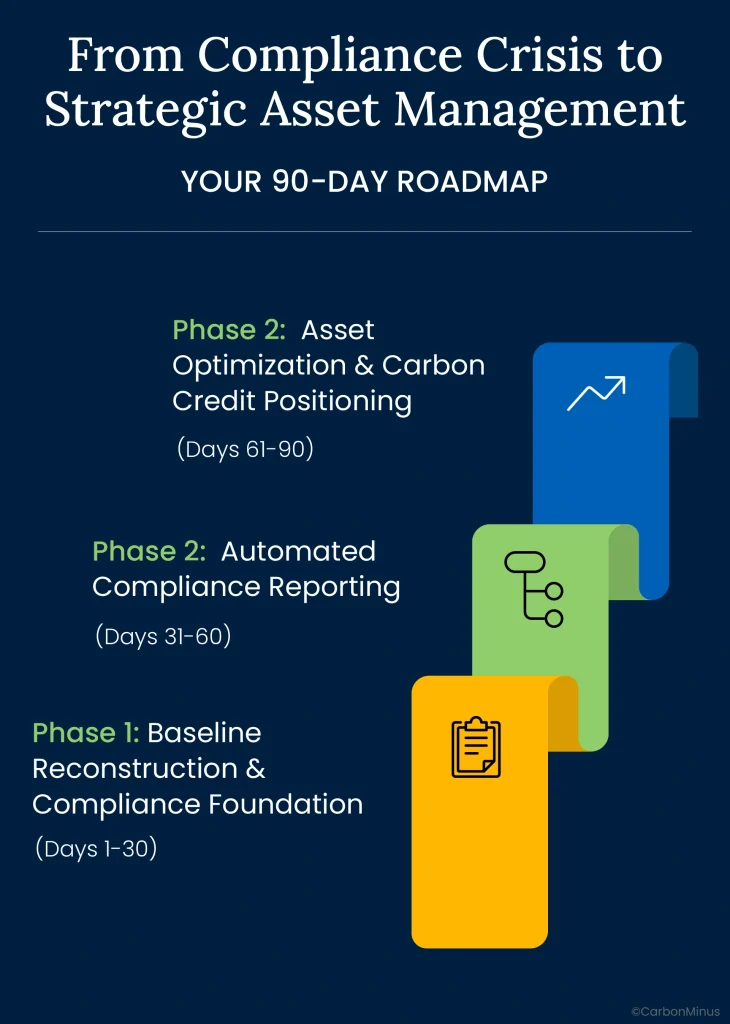
Phase 1: Baseline Reconstruction & Compliance Foundation (Days 1-30)
Actions:
Week 1: Compliance Obligation Mapping
- Identify which regulations apply to your facility: GEI Target Rules (if cement/aluminium/chlor-alkali/pulp & paper), PAT Cycle VII, Energy Conservation Rules, ISO 50001
- Document compliance deadlines and reporting requirements for each
- Assess penalties for non-compliance vs. revenue from overperformance
Week 2-3: Baseline Data Assessment
- Audit FY 2023-24 data availability: What exists? What’s missing?
- Compile available sources: shift logs, energy bills, SCADA archives, production records, maintenance logs
- Identify gaps requiring reconstruction or estimation
- Prioritize data quality issues that affect credit eligibility vs. minimum compliance
Week 4: Monitoring Deployment Initiation
- Deploy real-time monitoring on 20 highest-energy assets (typically covers 80% of facility consumption)
- Establish single source of truth data repository replacing spreadsheet chaos
- Begin FY 2025-26 baseline capture (critical for next compliance cycle)
Deliverable: Compliance-ready dataset meeting GEI + PAT + ISO 50001 baseline requirements, with documented gaps and mitigation strategies
Challenges to anticipate:
- Incomplete FY 2023-24 records (common across 60% of facilities)
- Data quality inconsistencies across different sources
- Production vs. energy data reconciliation requiring assumptions
- Third-party auditor standards (what level of reconstruction is acceptable?)
Phase 2: Automated Compliance Reporting (Days 31-60)
Actions:
Week 5-6: Platform Configuration
- Configure automatic GEI intensity calculations per product line: tCO₂e per tonne with Scope 1+2+3 tracking
- Set up PAT SEC dashboards: Real-time vs. target tracking with normalized metrics
- ISO 50001 EnPI monitoring: Energy Performance Indicators with automated alerts when degradation detected
- Compliance report templates: CPCB format, BEE format, SERC format,automated export from live data
Week 7: Quick Wins Implementation
- Fix identified inefficiencies delivering 10-15% savings in 60 days: compressed air leaks, idle equipment shutdowns, controls optimization
- Immediate payback: Leak repairs deliver 10-15x ROI with 3-4 month payback
- Use quick wins to demonstrate value and build internal support for full implementation
Week 8: Audit Readiness
- Third-party MRV preparation: Ensure data meets measurement, reporting, verification standards
- Test report generation: Can you produce compliant reports in 2 hours vs. 3 weeks?
- Document baseline reconstruction methodology for auditor review
Deliverable: 2-hour compliance report generation replacing 3-week manual process,98% time reduction
Value unlocked:
- Staff time freed from reporting chaos for value-add optimization work
- Real-time compliance status visibility (know your position vs. targets daily, not quarterly)
- Quick wins generating ₹50 lakhs-₹1.5 crore savings in first 60 days
Phase 3: Asset Optimization & Carbon Credit Positioning (Days 61-90)
Actions:
Week 9-10: Asset-Level Waste Quantification
- Identify equipment-specific waste: Which motors, compressors, furnaces cost most to operate?
- Prioritize replacement/repair decisions using energy + emissions + maintenance data
- Procurement guidelines update: Life cycle cost calculation mandatory for all energy-consuming equipment purchases
Week 11: Predictive Maintenance Integration
- Optimize maintenance scheduling based on consumption patterns, not arbitrary time intervals
- Integrate energy data with maintenance management systems (CMMS)
- Shift from reactive firefighting to condition-based maintenance
Week 12: Carbon Credit Strategy
- Model GEI overperformance potential: Daily tracking shows real-time position vs. targets
- Project credit eligibility for FY 2025-26 and FY 2026-27 cycles
- ESG reporting automation: BRSR, CDP, investor disclosures generated from compliance data
Deliverable: 20-30% savings pipeline identified and prioritized; carbon credit eligibility confirmed with revenue projections
Strategic positioning:
- Compliance infrastructure becomes operational asset driving daily decisions
- Regulatory data generates multiple revenue streams (not just avoids penalties)
- Organization culture shifts from reactive compliance to proactive optimization
Real-World Proof: The Pune Automotive Transformation
Theory is useful. Verified results are better.
Marelli Motherson Automotive Lighting India Pvt Ltd, Pune
The Company Profile:
- Automotive component manufacturer supplying European OEMs
- Export-focused with stringent customer sustainability requirements
- No existing energy baseline or asset-level monitoring prior to 2022
The Challenge:
- ISO 50001 certification became customer requirement,contract prerequisite
- No baseline data: 34-month energy baseline needed for EnMS certification
- Manual tracking insufficient: Existing spreadsheets didn’t meet ISO 50001 requirements
- Timeline pressure: Customer deadline for certification or lose contract renewals
The Implementation
Infrastructure Deployed:
- 1,000 IoT sensors strategically placed across entire facility
- Asset-level metering on:
- Compressed air systems (compressors, distribution, end-uses)
- Chillers and HVAC systems
- Lighting (by zone and shift)
- Production equipment (presses, molding machines, assembly lines)
- Support systems (materials handling, office areas)
Energy Management System (EnMS) Configuration:
- 34-month baseline automatically collected and statistically validated
- EnPI (Energy Performance Indicators) configured for:
- Specific Energy Consumption (SEC) by product line
- Compressed air efficiency (CFM per kWh)
- HVAC efficiency (cooling per unit floor area)
- Lighting efficiency (lux per watt)
- Overall facility energy intensity (kWh per unit output)
Operational Integration:
- Timestamped outputs linked to energy consumption by batch and shift
- Production normalization: Energy per unit output automatically adjusted for production mix
- Shift-level analysis: Day shift vs. night shift efficiency comparison revealing optimization opportunities
- Life cycle costing: All equipment procurement decisions now factor 15-year energy costs into selection criteria
The Quantified Results
Compliance Achievement:
- ISO 50001 certified with full EnMS implementation passing third-party audit
- Complete 34-month baseline met statistical validity requirements
- Continuous improvement demonstrated: Quarter-over-quarter EnPI improvements documented
Operational Outcomes:
- 163,320 kWh annual waste eliminated from compressed air system optimization alone,₹16.3 lakhs annual savings at ₹10/kWh
- 15-20% overall energy reduction achieved across facility through systematic optimization
- Reduced equipment failures: Condition monitoring via consumption patterns enabled predictive maintenance
- Maintenance optimization: Shifted from time-based to condition-based scheduling
Business Impact:
- Customer requirement satisfied: ISO 50001 certification secured contract renewals worth ₹50+ crore annually
- Export market access: EU customers mandate energy management certification; facility now compliant
- Competitive differentiation: Sustainability credentials enable premium positioning with environmentally-conscious customers
Operational Excellence:
- Daily decision-making transformed: 1,000 sensors provide actionable data driving shift-level optimization
- Continuous improvement culture: Energy performance reviewed in daily production meetings, not quarterly audits
- Cost structure advantage: 15-20% lower energy costs enable competitive pricing on bids
The Critical Lessons
Lesson 1: Compliance Infrastructure Becomes Operational Tool
The same monitoring system that satisfies ISO 50001 audit requirements drives daily operational decisions. Compliance and optimization aren’t separate,they’re the same infrastructure viewed through different lenses.
Lesson 2: Customer Requirements Drive Faster Than Regulations
While ISO 50001 isn’t yet mandatory under Indian law, it became contract-prerequisite for European customers. Market requirements often move faster than regulatory requirements.
Lesson 3: Payback Happens Faster Than Expected
163,320 kWh savings from compressed air alone (₹16.3 lakhs annually) plus 15-20% overall reduction (₹7.5-10 crore on ₹50 crore spend) means ₹65 lakh investment paid back in under 6 months.
Lesson 4: Competitive Advantage Compounds
Facilities with monitoring systems capture multiple advantages: lower costs, customer compliance, ESG credentials, predictive maintenance. Competitors without systems fall further behind each quarter.
The Window Closes Faster Than You Think
October 2025 brought regulatory clarity. It also started a countdown.
FY 2025-26 is the first GEI compliance year,already mid-year for plants notified in October. Facilities without real-time monitoring systems cannot prove overperformance for this cycle, missing ₹2-3 crore in carbon credit revenue.
FY 2026-27 is the second compliance cycle. To capture carbon credits that year, you need 12+ months of baseline data starting immediately. Every month of delay pushes eligibility further into the future.
ISO 50001 requires 34-month baseline for certification. Plants needing certification to protect export contracts must start monitoring NOW to achieve certification within customer timelines.
The Two Paths Forward
Path A: Checkbox Compliance
- Continue 3-week manual reporting nightmares quarterly
- Reconstruct baselines from incomplete data, hoping auditors accept gaps
- Achieve minimum compliance, avoiding penalties
- Miss ₹2-3 crore annual carbon credit revenue
- Risk losing ISO 50001-dependent export contracts
- Forgo 20-30% operational savings (₹5-15 crore)
- Watch competitors build efficiency advantages that compound
Path B: Strategic Asset Management
- Deploy monitoring infrastructure in 30 days
- Automate compliance reporting (3 weeks → 2 hours)
- Prove overperformance, earn tradable carbon credits
- Capture operational savings through real-time optimization
- Secure ISO 50001 certification protecting export revenue
- Position for ESG-linked financing with verified metrics
- Build 15-20% cost advantage vs. reactive competitors
The choice isn’t between compliance and optimization. It’s between expensive compliance that delivers nothing beyond avoiding penalties, and profitable compliance that generates ₹10-30+ crore in annual value.
The manufacturers recognizing this now,in October 2025 with FY 2025-26 already underway,are the ones who will lead their industries for the next decade. Those waiting for “perfect information” or “next budget cycle” will spend that decade explaining to Boards why competitors have 20-30% cost advantages.
Turn Your Compliance Burden Into Competitive Advantage
CarbonMinus delivers automated compliance for GEI, PAT, and ISO 50001 from a single platform,with BEE and CPCB reporting formats built-in, carbon credit tracking, and hardware-agnostic integration with your existing systems. Deploy in 30 days, achieve compliance in 60 days, capture carbon credit revenue in 90 days.
Calculate your carbon credit opportunity and see exactly how compliance infrastructure generates revenue, not just avoids penalties. [Book a Demo] or [ROI Calculator] to transform your August 2025 crisis into your biggest competitive advantage.
FAQs
1. We didn’t track asset-level data in FY 2023-24 (our GEI baseline year). Can we still comply?
Yes, but with important limitations. You can backfill baseline data from shift logs, SCADA historical exports, energy bills, and production records to achieve minimum compliance,avoiding the 2x market price penalties. However, reconstructed data typically lacks the granularity and audit trail needed to prove GEI overperformance for carbon credit eligibility. The practical outcome: you can pass audits but will likely miss ₹2-3 crore in annual carbon credit revenue this cycle. For FY 2026-27 (next compliance cycle), deploy monitoring NOW to capture full baseline data and position for credit eligibility.
2. How much does it cost to implement monitoring that satisfies GEI + PAT + ISO 50001 simultaneously?
Implementation costs range from ₹20-80 lakhs depending on facility size and number of assets monitored. A typical mid-sized plant (50-200 monitored assets) requires ₹40-50 lakhs for sensors, platform licensing, and integration. However, payback typically occurs in 6-12 months through identified savings. Quick wins like compressed air leak repairs deliver 10-15x ROI in 3-4 months. When you factor in avoided penalties (₹60-90 lakhs for GEI non-compliance), carbon credit revenue (₹2-3 crore annually), and operational savings (20-30%), the net cost is negative,the system generates more value than it costs multiple times over.
3. Can one monitoring system really handle GEI, PAT, ISO 50001, and Energy Conservation Rules simultaneously?
Yes,all four regulations require granular, asset-level, timestamped energy and emissions data. A properly designed platform collects data once and formats it for multiple reporting requirements. GEI needs emissions intensity per tonne (tCO₂e/tonne product), PAT needs SEC tracking (kWh/tonne product), ISO 50001 needs EnPI monitoring with 34-month baselines, Energy Conservation Rules need comprehensive asset inventories with consumption patterns. The data foundation is identical across all regulations; only report formats differ. Single-platform compliance is more cost-effective and eliminates data reconciliation errors vs. maintaining separate systems.
4. What’s the estimated value of carbon credits from GEI overperformance?
Estimated ₹1,000-₹1,500 per tonne CO₂e based on international carbon market benchmarks and PAT ESCert trading history (₹100 crore total trading volume in Cycle I). For a cement plant producing 1 million tonnes annually achieving 2.5% overperformance beyond target, that translates to ₹1.6-2.4 crore annually in tradable credits. Overperformance of 5% doubles credit value to ₹3.2-4.8 crore annually. Larger facilities or higher overperformance increase proportionally. Critical requirement: Verifiable, auditable, timestamped data proving overperformance,manual tracking and reconstructed baselines won’t qualify for credit certification.
5. Our facility is under PAT but not under GEI Target Rules (we’re not cement/aluminium/chlor-alkali/pulp & paper). Should we still implement asset-level monitoring?
Absolutely. Even without GEI obligations, asset-level monitoring delivers 20-30% operational savings compared to 5% from manual audits,that’s ₹10-15 crore annually for facilities spending ₹50 crore on energy. PAT compliance becomes automated instead of 3-week manual exercises every cycle. You position for future GEI expansion (currently 4 sectors, likely to expand to steel, pharma, chemicals). ISO 50001 certification (now customer requirement for exporters) requires this infrastructure anyway. The ROI exists independent of carbon credit eligibility through operational savings, PAT ESCert trading, and market access benefits.
6. How long does it take to establish an ISO 50001-compliant energy baseline?
ISO 50001 recommends minimum 34 months for statistical validity,capturing seasonal variations, production mix changes, and eliminating anomalies. This ensures your baseline is defensible to third-party auditors. However, you can achieve provisional certification within 12-18 months with phased implementation showing continuous improvement trajectory. The critical factor is starting immediately,every month of delay pushes certification 1 month further. Plants needing ISO 50001 for export contracts (increasingly common with European customers) should prioritize monitoring deployment within 30 days to begin baseline capture.
7. What if we’re already mid-audit cycle,can we still implement during active compliance period?
Yes, in fact, it’s ideal. Implementing during FY 2025-26 (current GEI compliance year) allows you to:
- Capture second half of FY 2025-26 data with verified monitoring (better than full-year reconstruction)
- Position for complete FY 2026-27 baseline (next compliance cycle) to maximize carbon credit eligibility
- Deliver quick wins (leak repairs, idle equipment optimization) showing immediate value in 30-60 days