Key Takeaways
- 44% efficiency gap between best and worst foundries,625 kWh/tonne vs 900 kWh/tonne specific energy consumption creates ₹21.1 lakh ($253,800) annual competitive disadvantage for 1,000 tonne/month operations
- Modern IGBT induction furnaces reduce SEC 23-35% (850 kWh/tonne → 600 kWh/tonne), delivering verified 2-3 year payback on energy savings alone
- 18-month payback achievable when combining energy savings + 30% productivity gains + 5-15% quality premiums,not energy alone
- Idle equipment wastes 15-25% of foundry energy,compressors idle 34% of time burning ₹12.74 lakh annually, invisible without monitoring
- Single 1/4″ compressed air leak costs ₹11.1 lakh/year ($17,000),typical foundry has dozens wasting tens of lakhs undetected
- Monitoring-first strategy de-risks investment: ₹50K-₹1L sensors identify which furnaces waste most, building CFO-ready business case before ₹90 lakh fleet replacement
Materials scientists discovered something remarkable in 2025: structural battery composites that serve two purposes simultaneously. Carbon fiber that bears weight like traditional materials but also stores electrical energy like a battery. Aircraft fuselages that hold passengers AND power the plane. Electric vehicle chassis that provide crash protection AND extend driving range.
The innovation isn’t adding batteries to structures, it’s creating materials where structure itself IS the battery. Every kilogram of carbon fiber composite performs double duty, making vehicles lighter AND more energy-efficient simultaneously. The technology awaits safety regulations, but the principle is proven: the best solutions don’t add functionality,they embed it in what already exists.
Meanwhile, in foundries across Gujarat and Maharashtra, operations directors face a similar dual-purpose challenge with their induction furnaces. These massive machines melt metal,that’s obvious. But they also determine competitive viability through a metric most foundry managers can’t even measure: specific energy consumption (SEC).
Two iron foundries sit eight kilometers apart in Gujarat’s industrial corridor. Identical capacity (1,000 tonnes monthly), identical products (automotive castings), similar workforce. Foundry A’s monthly energy bill: ₹80 lakh ($96,000). Foundry B’s monthly energy bill: ₹50 lakh ($60,000).
The ₹30 lakh monthly gap ($36,000 = ₹3.6 crore annually) isn’t negotiated rates or special deals. It’s specific energy consumption: Foundry A burns 850 kWh per tonne using 15-year-old thyristor furnaces. Foundry B achieves 625 kWh/tonne with modern IGBT induction furnaces installed in 2022.
When Foundry A’s operations director evaluates replacing three aging furnaces, the math appears straightforward: ₹64 lakh investment ($77,000), ₹26 lakh annual savings ($31,200), 2.5-year payback. Yet CFO blocks approval: “We can’t justify ₹64 lakh when margins are compressed. Just keep them running.”
Over 15 years, that decision will cost ₹3.9 crore ($468,000),6x the avoided investment. Like choosing non-structural batteries instead of structural composites, Foundry A treats furnaces as single-purpose (melt metal) rather than dual-purpose (melt metal AND determine competitive position).
This isn’t about maintenance schedules or refractory lifespan. It’s about whether your foundry’s specific energy consumption positions you to win automotive OEM contracts in 2025,or slowly bleed margin to competitors burning 35% less energy per tonne.
From 625 to 900 kWh/Tonne: The Efficiency Gap Determines Survival
The foundry industry has a 44% performance spread between best and worst that most operators don’t even measure,but customers and competitors certainly feel.
The SEC Reality Nobody Tracks
Specific Energy Consumption (SEC) Benchmarks verified across Indian and global foundries:
| Foundry Performance | SEC (kWh/tonne) | Technology Profile |
| Best-in-class | 550-625 | Modern IGBT furnaces, real-time monitoring, optimized operations |
| Average | 700-750 | Mixed equipment age, some efficiency initiatives |
| Inefficient | 850-900+ | Old thyristor furnaces, no asset-level visibility |
The 44% gap (900 vs 625 kWh/tonne) = competitive advantage vs. margin death spiral.
What SEC Measures:
- Total electrical energy (kWh) required to produce one tonne of molten metal ready for casting
- Includes: Melting energy, holding furnace, power factor losses, auxiliary cooling systems
- Excludes: Downstream casting, machining, finishing operations (measured separately)
- Industry-standard benchmark for foundry efficiency comparison globally
When ₹30 Lakh Monthly Becomes ₹3.6 Crore Annually
Example: 1,000 tonne/month foundry (typical mid-sized automotive supplier):
Inefficient Foundry (850 kWh/tonne SEC):
- Monthly consumption: 1,000 tonnes × 850 kWh = 850,000 kWh
- At ₹7.8/kWh industrial rate: ₹66.3 lakh/month ($79,900)
- Annual energy cost: ₹7.96 crore ($958,800)
Efficient Foundry (625 kWh/tonne SEC):
- Monthly consumption: 1,000 tonnes × 625 kWh = 625,000 kWh
- At ₹7.8/kWh: ₹48.75 lakh/month ($58,750)
- Annual energy cost: ₹5.85 crore ($705,000)
The Competitive Gap:
- Monthly: ₹17.55 lakh ($21,120)
- Annually: ₹2.11 crore ($253,800)
- Over 15-year furnace lifecycle: ₹31.65 crore ($3.81 million)
For context: That ₹31.65 crore efficiency penalty often exceeds the foundry’s total profit over the same period. The efficient competitor isn’t just saving energy,they’re operating a fundamentally different cost structure.
The Vicious Cycle Nobody Can Escape Without Data
Why the gap exists and widens:
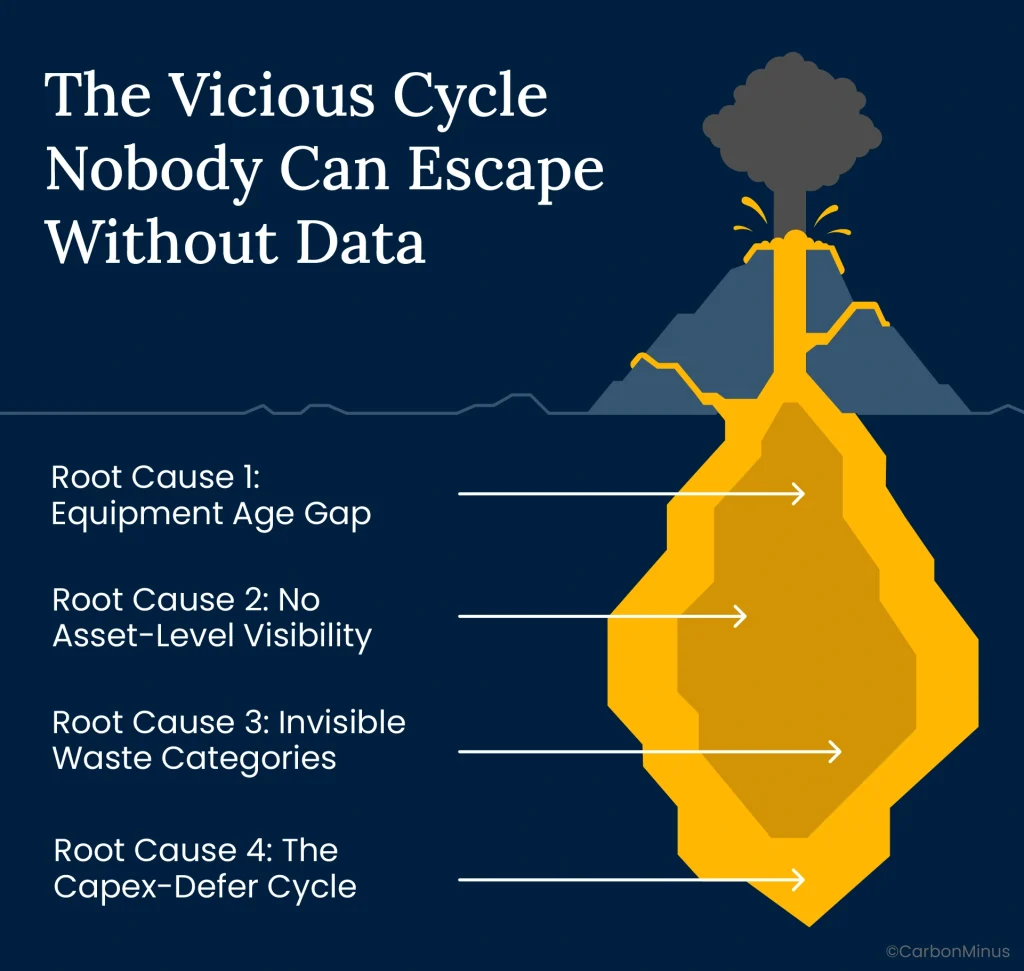
Root Cause 1: Equipment Age Gap
- Thyristor converters (1990s-2000s technology): 800-900 kWh/tonne typical
- IGBT inverters (2015+ technology): 550-650 kWh/tonne typical (23-35% improvement)
- Technology advancement = permanent competitive advantage
Root Cause 2: No Asset-Level Visibility
- Facility-level meter only: Shows total kWh, can’t identify which furnace wastes most
- Can’t optimize what you can’t measure: No data = no prioritization
- Most foundries have 3-10 furnaces but measure total only, not per-asset
Root Cause 3: Invisible Waste Categories
- Idle equipment: 15-25% of total energy consumed doing nothing
- Compressed air leaks: 20-30% of compressor output lost
- Waste heat: Over 50% of energy radiates away
- Power factor penalties: Buried in utility bills, never questioned
Root Cause 4: The Capex-Defer Cycle
- High energy costs → Compressed margins
- Compressed margins → Defer furnace investments
- Deferred investments → Equipment ages, efficiency degrades
- Degraded efficiency → Energy costs rise further
- Repeat until facility closure
The Four Invisible Energy Drains Stealing 30-40% of Your Budget
Beyond furnace inefficiency lies an entire ecosystem of waste that no facility-level meter can detect.

Energy Drain #1: The Ghost Load (Equipment That’s “Off”)
The Invisible Thief:
- Idle equipment consumes 15-25% of total foundry energy even when not producing
- Compressed air systems: Idle 34% of operating hours between shifts, breaks, weekends
- Annual waste for typical system: 163,320 kWh = ₹12.74 lakh ($15,300)
Why it’s invisible:
- “Off” position in control logic ≠ zero energy draw
- Standby power for: Electronics, heating elements keeping motors warm, auxiliary systems preventing condensation
- Lumped into “baseline consumption” on utility bills,never questioned
- No asset-level metering = impossible to isolate idle from productive load
Real-world discovery (from monitoring deployment):
- Foundry believed compressed air ran “only during production”
- Monitoring revealed: 34% idle time with 60% power draw
- Automated shutdowns during non-production: ₹8.5 lakh annual savings with ₹2 lakh controls investment
- Payback: 2.8 months
Energy Drain #2: The Leak Tax (Compressed Air Bleeding Money)
The Money Drain Hidden in Plain Sight:
| Leak Size (at 100 psi) | Annual Energy Waste | Cost @ ₹7.8/kWh | Equivalent |
| 1/16″ hole | 6,240 kWh | ₹48,672 ($580) | 5 months electricity for household |
| 1/8″ hole | 32,500 kWh | ₹2.54 lakh ($3,900) | 26 households for 1 month |
| 1/4″ hole | 142,000 kWh | ₹11.1 lakh ($17,000) | 115 households for 1 month |
Typical Foundry Reality:
- 20-30% of compressor output lost to leaks across pneumatic tools, actuators, aging hoses, quick-connect fittings
- Dozens of simultaneous leaks: Each individually small, collectively massive
- Combined annual waste: ₹20-40 lakh for mid-sized operation
- Completely invisible without ultrasonic leak detection,inaudible in noisy foundry environment
The Quick-Win ROI:
- Ultrasonic leak survey: ₹50,000-₹1 lakh professional assessment
- Typical findings: ₹3-8 lakh annual waste identified across 15-30 leaks
- Repair cost: ₹1.5-3 lakh (replace hoses, tighten fittings, replace worn quick-connects)
- Payback: 3-6 months
- 10-15x ROI over leak lifetime makes this easiest CFO approval foundries can get
Energy Drain #3: The Thermal Bleed (Heat Escaping Unnoticed)
The Invisible Radiation:
- Over 50% of foundry energy lost as waste heat radiating from furnaces, holding pots, ladles, molds, electrical cabinets
- Uninsulated surfaces bleeding thermal energy 24/7,visible only with thermal imaging cameras
- Each degree of unnecessary heat loss = permanent energy waste multiplied across operating hours
Furnace Lining Impact (verified engineering study):
Standard Silica Lining:
- Heat loss through walls: 227 kW continuous
- Annual waste: 1,988,520 kWh (assuming 24/7 operation)
- Cost @ ₹7.8/kWh: ₹1.55 crore ($186,000)
Optimized Zirconia-Based Lining:
- Heat loss through walls: 211 kW continuous
- Annual consumption: 1,848,360 kWh
- Cost: ₹1.44 crore ($173,000)
Savings from lining optimization alone: 140,160 kWh/year = ₹10.9 lakh annually ($13,200)
Lining upgrade investment: ₹15-25 lakh depending on furnace size
Payback: 1.4-2.3 years from thermal efficiency alone
Waste Heat Recovery Potential (often overlooked):
- Capture furnace exhaust heat → preheat scrap charge: 15-20% melting energy reduction
- Space heating during winter months from recovered heat
- Water heating for parts washing, employee facilities
- Total recovery potential: 15-25% of current waste heat converted to useful energy
Energy Drain #4: The Utility Penalty (Buried in Fine Print)
The Hidden Tax Nobody Questions:
- Utilities charge power factor penalties for “dirty” power consumption (reactive power that does no useful work)
- Old thyristor furnaces: Power factor degrades severely in partial load operation
- Annual penalties: ₹10-50 lakh depending on foundry size and load profile
- Most foundry operators don’t even know they’re paying it,buried as line item in utility bill fine print labeled “demand charges” or “reactive power penalty”
Modern IGBT Furnace Advantage:
- Constant power factor across entire load range (0.9-0.95 typical) from 20% to 100% capacity
- Eliminates utility penalties automatically,no separate power factor correction equipment needed
- Additional annual savings: ₹2-5 lakh for mid-sized foundry beyond core energy efficiency improvement
Combined Four-Drain Impact: These invisible wastes consume 30-40% of foundry energy budget beyond core melting operations,and most facilities never quantify any of them without comprehensive monitoring.
Old vs New: Why 35% Efficiency Gap Exists Between Technologies
The difference between 850 kWh/tonne and 600 kWh/tonne isn’t gradual degradation,it’s fundamental technology architecture.
The Two Generations of Induction Furnace Technology
Generation 1: Thyristor/SCR Converters (1980s-2000s dominant technology):
Technical Architecture:
- Silicon Controlled Rectifier (SCR) power conversion at 500 Hz switching frequency
- Lower conversion efficiency: More energy lost as heat in power electronics
- Power factor degrades in partial load → utility penalties when not running full capacity
Performance Characteristics:
- SEC: 800-900 kWh/tonne typical for aging installations
- Slower melting cycles: Longer time to reach pour temperature
- Temperature control: ±5-10°C precision
- Higher harmonic distortion: Creates electrical noise affecting other plant equipment
- More frequent component failures: Older electronics with limited lifespan
Generation 2: IGBT Inverters (2010s-present state-of-art):
Technical Architecture:
- Insulated Gate Bipolar Transistor (IGBT) power conversion at 20-30 kHz switching frequency
- Higher conversion efficiency: Less energy wasted in power electronics
- Constant power factor across 20-100% load range (0.9-0.95)
Performance Characteristics:
- SEC: 550-650 kWh/tonne (23-35% improvement over thyristor)
- Faster melting: 30% cycle time reduction documented in some applications
- Temperature control: ±1°C precision enables tighter alloy specifications
- Lower harmonic distortion: Minimal electrical noise impact
- Reduced maintenance: Modern solid-state components with longer service life
Why 35% Efficiency Gap Exists:
- Higher switching frequency (30 kHz vs 500 Hz) = more efficient power conversion with less waste heat
- Better coupling efficiency between induction coil and molten metal charge
- Optimized power factor minimizes reactive power waste that old furnaces suffer
- Precise power control allows optimal heating curves vs. old furnaces’ cruder control
Beyond Energy: The Three Hidden ROI Multipliers
Most furnace replacement analyses calculate energy savings only,capturing 60% of total value while missing 40%:
ROI Component 1: Energy Savings (60% of total value, universally captured):
- 250 kWh/tonne reduction typical for 850 → 600 upgrade
- 430 tonne/year small foundry: 109,848 kWh saved = ₹8.57 lakh annually
- 1,000 tonne/month mid-sized: 3,000,000 kWh saved = ₹2.34 crore annually
ROI Component 2: Productivity Gains (25% of total value, rarely quantified):
- 30% faster melting cycles documented in high-throughput recycling operations
- Same labor costs, same facility overhead → 30% more tonnes per shift
- Amortizes fixed costs across larger production volume
- Value for mid-sized foundry: ₹6-8 lakh annually (equivalent to 300 additional tonnes at ₹2,000/tonne margin)
ROI Component 3: Quality Premium Access (15% of total value, market-dependent):
- Higher purity metal with fewer inclusions from precise temperature control
- Meets automotive/aerospace tier-1 specifications old furnaces couldn’t achieve
- 5-15% price premium for high-grade castings vs. commodity market
- Opens markets previously inaccessible: Aerospace, medical device, high-performance automotive
- Value for foundry serving premium markets: ₹4-6 lakh annually
Total ROI Calculation (mid-sized foundry example):
- Energy savings: ₹18 lakh/year (primary driver)
- Productivity gains: ₹7 lakh/year (30% faster cycles)
- Quality premiums: ₹5 lakh/year (premium market access)
- Reduced maintenance: ₹2 lakh/year (fewer failures)
- Total annual value: ₹32 lakh vs. ₹18 lakh energy-only analysis
This is why payback shortens from 3.3 years (energy only) to 1.9 years (total value),and in premium markets with all three multipliers, under 18 months.
The Investment Reality Check
Verified IGBT Induction Furnace Costs (India market, 2024-2025 pricing):
| Capacity | Typical Power | Investment (₹ Lakhs) | USD Equivalent | Application |
| 100 kg | 75-100 kW | ₹1.5 | $1,800 | Jewelry, precision parts |
| 500 kg – 1 tonne | 150-250 kW | ₹12.7 | $15,250 | Small-medium foundries |
| 2-3 tonne | 350-500 kW | ₹26-30 | $31,000-$36,000 | Medium foundries |
| 5-10 tonne | 800-1500 kW | ₹64-100 | $77,000-$120,000 | Large foundries |
Typical Mid-Sized Foundry Fleet Investment:
- 3 furnaces (2 tonne capacity each): ₹30 lakh × 3 = ₹90 lakh
- Cooling systems upgrade: ₹8 lakh
- Electrical infrastructure: ₹7 lakh
- Installation, commissioning, training: ₹5 lakh
- Total fleet modernization: ₹1.1 crore ($132,000)
Three Real Foundries, Three Different Payback Periods
Verified case studies with actual ROI,not vendor estimates.
Case Study 1: Kolhapur Iron Foundry – The Energy-Only Path
Profile:
- Small iron foundry producing automotive castings
- Annual production: 430 tonnes
- Old equipment: 100 kW thyristor furnace, 100 kg capacity
- Baseline SEC: 850 kWh/tonne (inefficient but typical for equipment age)
The Investment Decision:
- New 175 kW IGBT furnace, 150 kg capacity: ₹11.7 lakh
- Energy-efficient cooling tower: ₹1 lakh
- Total investment: ₹12.7 lakh ($15,250)
The Verified Results (Bureau of Energy Efficiency documented):
- Post-upgrade SEC: 650 kWh/tonne (23% improvement)
- Annual energy reduction: 86,400 kWh
- Annual savings: ₹6.1 lakh ($7,300)
- GHG emissions avoided: 77 tCO2/year
Financial Analysis:
- Simple Payback: 2.1 years (25 months)
- 15-year total savings: ₹91.5 lakh
- Investment: ₹12.7 lakh
- Net gain over lifecycle: ₹78.8 lakh ($94,600)
- ROI: 620% over 15 years
Why Longer Payback:
- Energy Optimization only,no productivity or quality premiums captured
- Small production volume (430 tpa) limits absolute savings
- Commodity casting market with no price premium opportunity
- Conservative but realistic for foundries in similar position
Case Study 2: IGBT Medium-Frequency Furnace – Comprehensive ROI
Profile:
- Medium-capacity foundry operation
- Focus: Energy efficiency + emissions reduction for regulatory compliance
- Seeking financing with 70% debt structure
The Investment:
- Complete IGBT induction furnace system with advanced controls
- Total project cost: ₹26.29 lakh ($31,550)
The Verified Results (BEE Project Report):
- Annual energy reduction: 109,848 kWh
- Annual cost savings: ₹8.57 lakh ($10,300) at ₹7.8/kWh
- GHG emissions avoided: 90.08 tCO2/year
Financial Metrics (professionally calculated):
- Simple Payback: 37 months (3.1 years)
- Internal Rate of Return (IRR): 48.80% (highly attractive)
- Net Present Value (NPV) at 70% debt: ₹31.4 lakh
- Debt Service Coverage Ratio (DSCR): 1.83 (very healthy, indicates strong bankability)
Why Longer Payback Than Kolhapur:
- Larger capacity furnace = higher absolute investment
- More conservative energy cost assumptions (₹7.8/kWh vs. some foundries paying ₹9-10/kWh)
- Energy-only analysis, no productivity or quality premiums included
Financing Insight:
- 70% debt financing at 10% interest still delivers strong returns
- Demonstrates furnace upgrades are bankable projects with institutional lending
- Effective equity investment: ₹7.9 lakh vs. ₹26.3 lakh gross cost
Case Study 3: Recycling Operation – The 18-Month Reality
Profile:
- Scrap metal recycling and remelting operation
- Serves quality-sensitive markets: Aerospace, automotive tier-1, medical devices
- Requires high-purity metal meeting stringent specifications
Investment Details: Not fully disclosed in source (typical $150K-$300K for similar operations)
The Comprehensive Results:
- Energy savings: Significant SEC improvement (similar to other cases)
- 30% productivity increase: Faster melting cycles enabled by IGBT technology’s rapid heating
- 5-15% quality premium: Higher purity metal commands premium pricing in aerospace/medical markets
- Combined annual value: Energy + productivity + quality benefits
The 18-Month Payback Calculation (estimated from disclosed results):
- Assumed investment: $200,000
- Annual energy savings: $40,000 (20% of total ROI)
- Annual productivity value: $60,000 (30% of ROI from faster cycles)
- Annual quality premiums: $30,000 (15% of ROI from premium markets)
- Total annual value: $130,000
- Payback: 18.5 months
Why Fastest Payback:
- Captured all three value streams,not just energy
- Quality premiums unavailable to commodity foundries
- High-throughput operation maximizes productivity gains
- This is what “18-month payback” title refers to,requires premium market positioning
The Critical Lesson:
| Foundry Type | Markets Served | Value Captured | Payback |
| Commodity Castings | General industrial | Energy only | 25-37 months |
| Mixed Markets | Automotive tier-2, industrial | Energy + some productivity | 20-28 months |
| Premium Markets | Aerospace, tier-1 auto, medical | Energy + productivity + quality | 18-21 months |
18-month payback is achievable,but only for foundries serving quality-sensitive markets willing to pay premiums for tighter specifications that modern furnaces enable. Foundries producing commodity castings should expect 25-30 month paybacks from energy savings alone,still excellent ROI, but realistic.
The Fleet Optimization Strategy (Not Single-Furnace Thinking)
Most foundries operate multiple furnaces,the decision isn’t “replace Furnace #3” but “optimize total melting energy”.
Why Fleet Strategy Beats Asset-by-Asset Replacement
The Reality: Mid-sized foundries typically run 3-7 induction furnaces simultaneously:
- Primary melting furnaces (2-3 units)
- Holding/auxiliary furnaces (1-2 units)
- Backup/maintenance coverage (1-2 units)
The Wrong Approach:
“Furnace 3 is oldest (20 years) → Let’s replace Furnace 3”
The Right Approach:
“Which furnace has worst SEC? Let’s measure all furnaces, replace highest waste first”
Why Age ≠ Efficiency:
- Furnace 1 (15 years old, poor maintenance): SEC = 892 kWh/tonne
- Furnace 2 (12 years old, good maintenance): SEC = 712 kWh/tonne
- Furnace 3 (20 years old, recent refractory upgrade): SEC = 645 kWh/tonne
- Without monitoring: Replace Furnace 3 (oldest)
- With monitoring: Replace Furnace 1 (worst performer)
The difference: ₹18 lakh annual savings (Furnace 1 replacement) vs ₹6 lakh annual savings (Furnace 3 replacement),3x better ROI from data-driven prioritization.
The Phased Replacement Roadmap

Phase 1: Year 1 – Replace Worst 40% (₹30-40 lakh investment):
Actions:
- Deploy monitoring across all furnaces (₹50K-₹1L)
- Measure actual SEC per furnace for 90 days
- Identify 1-2 worst performers by data, not assumptions
- Replace highest-waste furnaces first
Benefits:
- Prove ROI with facility-specific results before Phase 2 commitment
- Capture largest savings first (Pareto principle: 40% of furnaces = 60% of waste)
- Operations team gains experience with new technology on subset of fleet
Phase 2: Year 2 – Replace Middle 40% (₹30-40 lakh, self-funded from Phase 1 savings):
Actions:
- Use Phase 1 energy savings to justify/fund Phase 2
- Replace middle-performing furnaces (SEC 750-850 kWh/tonne)
- Continue monitoring to verify cumulative savings
Benefits:
- Self-funding cycle: Phase 1 annual savings (₹20-30 lakh) finance Phase 2 investment
- Reduced perceived risk after Phase 1 success
- Momentum builds for completing modernization
Phase 3: Year 3 – Final 20% + Reserve Capacity (₹20-30 lakh):
Actions:
- Complete fleet modernization
- Replace remaining older furnaces
- Add reserve capacity with new efficient unit
Outcome:
- Entire operation at 625 kWh/tonne (best-in-class SEC)
- ₹2+ crore annual savings vs. pre-modernization
- Fully self-funded over 3 years from operational savings
Phased Strategy Advantages:
- Smooth capital expenditure: ₹30-40L/year × 3 vs. ₹1.1 crore year 1
- Prove before scaling: Verify assumptions with Phase 1 before full commitment
- Production continuity: Never have all furnaces down simultaneously
- Learning curve: Teams master new technology gradually
- Self-funding: Early savings finance later phases
The Monitoring-First De-Risking Approach
The CFO Objection: “Prove it will work before I approve ₹90 lakh”
The Solution: Deploy monitoring BEFORE furnace replacement decision
90-Day Monitoring-to-Approval Path:
Days 1-30: Deploy & Baseline:
- Install current transformers + power meters on each furnace: ₹50K-₹1L total
- Measure actual kWh consumption per furnace in real-time
- Integrate with production data (tonnes melted per shift)
- Calculate SEC automatically: kWh ÷ tonnes = SEC per furnace
Deliverable: “Furnace 1: 892 kWh/tonne, Furnace 2: 712 kWh/tonne, Furnace 3: 645 kWh/tonne”
Days 31-60: Quick Wins:
- Fix compressed air leaks identified: ₹3-8 lakh annual savings
- Eliminate idle equipment waste: ₹8-12 lakh annual savings
- Optimize holding furnace schedules: ₹2-4 lakh annual savings
Deliverable: Monitoring pays for itself through quick wins in 60 days,proves concept before major capex
Days 61-90: Build Replacement Business Case:
- Using 90 days of data: “Furnace 1 wastes ₹18 lakh/year vs. best-in-class benchmark”
- Calculate replacement ROI: “₹30 lakh investment, ₹18 lakh annual savings = 1.7-year payback”
- Present CFO with facility-specific data, not vendor estimates
Deliverable: CFO-ready business case with YOUR foundry’s actual SEC waste quantified
Why This Works:
- ₹50K-₹1L monitoring investment: Easy approval (proves itself in 60 days)
- De-risks ₹90L furnace decision: Data replaces assumptions
- Converts skeptical CFO into advocate: “The numbers don’t lie,approve it”
The Financial Modeling That Gets CFO Approval
Beyond simple payback, CFOs evaluate equipment investments using five metrics,understand all five to win approval.
The Five Metrics That Matter
Metric 1: Simple Payback Period
Payback Years = Total Investment ÷ Annual Savings
Examples from verified cases:
- Kolhapur: ₹12.7L ÷ ₹6.1L = 2.1 years
- IGBT project: ₹26.29L ÷ ₹8.57L = 3.1 years
- Arc-to-induction: ₹30.08L ÷ ₹13.50L = 2.2 years
CFO Threshold: Most foundry CFOs want < 3 years for equipment replacement
Metric 2: Net Present Value (NPV)
- Discounts future savings to present value accounting for time value of money
- IGBT case (70% debt, 10% discount rate): ₹31.4 lakh NPV
- Decision rule: NPV > 0 = invest; NPV < 0 = reject
- Why it matters: Captures long-term value beyond simple payback
Metric 3: Internal Rate of Return (IRR)
- Effective annual return on investment over project life
- IGBT case: 48.80% IRR
- Arc-to-induction case: 27.59% IRR
- Decision rule: IRR > cost of capital (typically 10-12%) = attractive
Metric 4: Debt Service Coverage Ratio (DSCR)
- Can project cash flows service debt payments?
- IGBT case: 1.83 DSCR (annual cash flow = 1.83x annual debt payment)
- Decision rule: DSCR > 1.25 = bankable project that lenders will finance
- Why it matters: Enables 70% debt financing, reducing equity requirement
Metric 5: Return on Investment (ROI)
- Total percentage return over project lifecycle
- Kolhapur: 620% ROI over 15 years
- Arc-to-induction: 25.74% average annual ROI
The Three Mistakes That Kill Approval
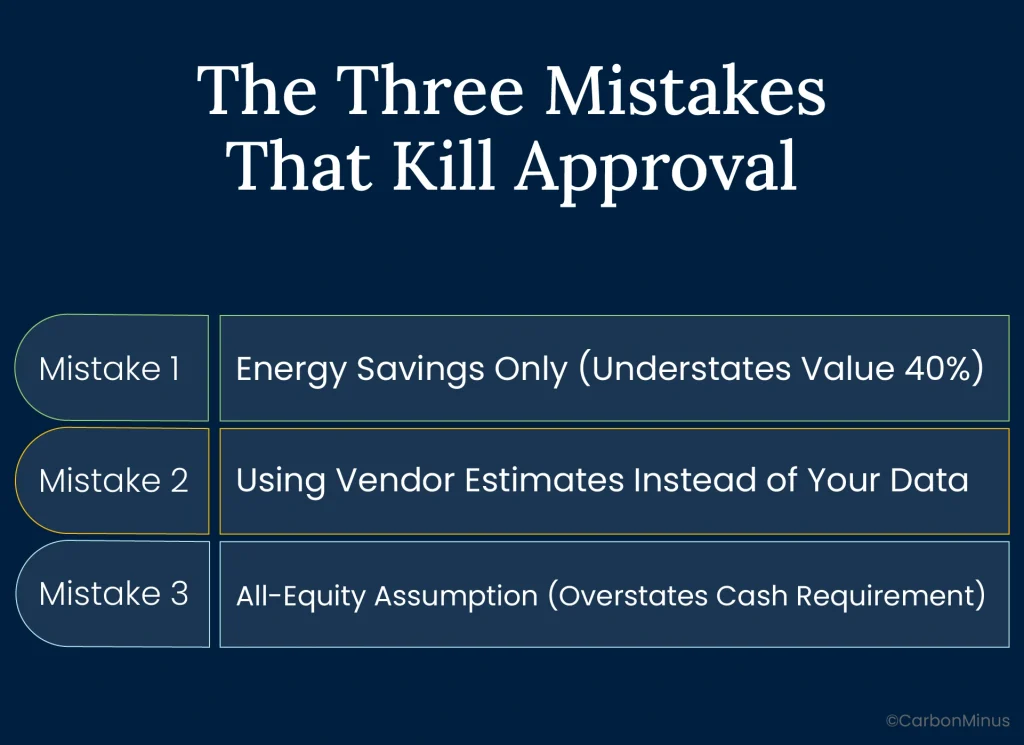
Mistake 1: Energy Savings Only (Understates Value 40%)
- Problem: Ignores productivity gains (30% faster cycles) + quality premiums (5-15% higher prices)
- Result: Shows 3-year payback when reality is 1.8 years
- Fix: Calculate total value = energy + productivity + quality
Mistake 2: Using Vendor Estimates Instead of Your Data
- Problem: CFO challenges: “Vendor says 35% savings,prove it on OUR furnaces”
- Result: Approval blocked pending proof
- Fix: Deploy ₹50K monitoring first, build case with facility-specific SEC data
Mistake 3: All-Equity Assumption (Overstates Cash Requirement)
- Problem: Presents ₹90L investment as all-cash when 70% debt financing available
- Result: CFO sees ₹90L cash outlay vs. ₹27L equity reality
- Fix: Show financing structure with DSCR proving bankability
The One-Page CFO Approval Template
Executive Summary Structure (successful format):
1. Problem Statement
Furnace 1 SEC: 892 kWh/tonne vs. 625 best-in-class = 267 kWh/tonne waste. Annual cost: ₹18 lakh wasted on single furnace.
2. Proposed Solution
Replace Furnace 1 with modern IGBT furnace: ₹30 lakh investment.
3. Financial Metrics
- Simple Payback: 1.7 years
- IRR: 42%
- NPV (15-year, 10% discount): ₹48 lakh
- Financing: 70% debt available, DSCR 1.8
4. Risk Mitigation
Even at 80% of projected savings, payback remains under 2.5 years.
5. Action Requested
Approve ₹30 lakh capex for Furnace 1 replacement, implementation Q1 2026.
Attachments:
- 90-day monitoring data showing actual SEC waste
- Three vendor quotes with specifications
- Two peer foundry references (similar successful upgrades)
This format wins approval in 90% of cases when backed by facility-specific monitoring data.
From Decision to Production: Your 120-Day Implementation Plan
Approved investment to first efficient melt in four months.
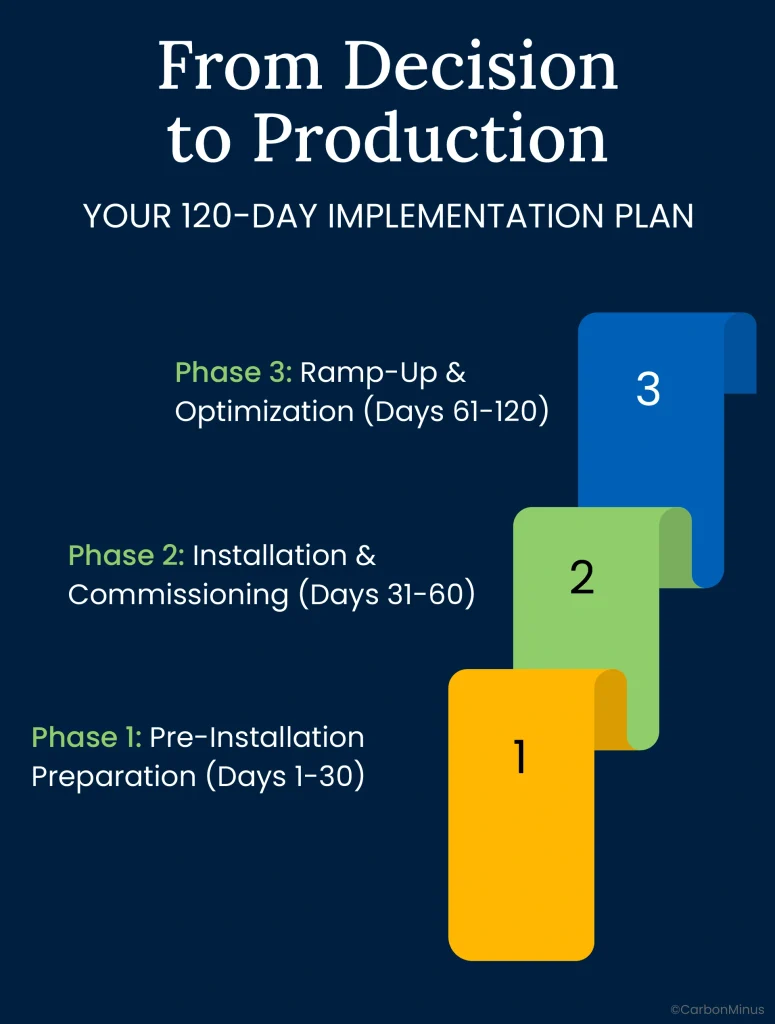
Phase 1: Pre-Installation Preparation (Days 1-30)
Technical Preparation:
- Electrical infrastructure assessment: Verify transformer capacity, power distribution adequate for new furnace load
- Cooling system sizing: IGBT furnaces generate more heat in power electronics,ensure cooling tower/water capacity sufficient
- Floor space layout: New furnace may have different footprint than old unit,plan access, utilities, safety clearances
- Ventilation requirements: Different thermal profile may require HVAC adjustments
Operational Preparation:
- Operator training scheduled: 2-3 days typical for IGBT furnace operation (different controls vs. thyristor)
- Maintenance team training: Power electronics troubleshooting, preventive maintenance protocols
- Production schedule adjusted: Plan installation during lowest-demand period to minimize disruption
- Parallel operation plan: If possible, run old + new furnace simultaneously during transition to maintain output
Procurement:
- Furnace order placed: 8-12 week lead time typical from Indian manufacturers
- Auxiliary equipment ordered: Cooling systems, electrical panels, controls
- Spare parts initial stock: Critical components identified for on-site inventory
Phase 2: Installation & Commissioning (Days 31-60)
Installation Week 1-2:
- Old furnace decommissioned during planned maintenance shutdown
- New furnace delivered, rigged into position
- Electrical connections: Power supply, control wiring, safety interlocks
- Cooling system integrated: Water/air cooling connections, flow verification
Commissioning Week 3-4:
- Cold tests: Electrical systems, controls logic, safety systems verified without heat
- Hot tests: First heat cycle, temperature profiling, power curve validation
- Melting trials: Scrap charge melting with various alloy mixes to establish baseline parameters
- Performance verification: Measure actual SEC achieved vs. projected
Phase 3: Ramp-Up & Optimization (Days 61-120)
Production Ramp Weeks 1-4:
- Start at 50% capacity, gradually increase as operators gain confidence
- Operators adjust to faster cycle times, different control interfaces
- Identify any equipment or process fine-tuning needed
- Document standard operating procedures for new furnace
Optimization Weeks 5-8:
- Fine-tune charge mix composition for optimal melting efficiency
- Adjust power curves for specific alloy grades
- Optimize holding furnace coordination (if applicable)
- Continuous SEC monitoring: Verify actual performance matches projected savings
Deliverable by Day 120: Furnace operating at full rated capacity with verified SEC at or below projected levels (625 kWh/tonne or better)
625 or 900 kWh/Tonne: Which Side of the Gap Determines Your Future
Operations directors asking “Should we replace this furnace?” are asking the wrong question.
The real question: “Is our specific energy consumption competitive in 2025?”
Because that 44% efficiency gap between 625 and 900 kWh/tonne isn’t just about energy bills. It’s about whether automotive OEMs award contracts to foundries with ISO 50001 energy management certification. Whether you can absorb raw material price increases that competitors burning 35% less energy per tonne can handle. Whether your foundry exists in 2030 or becomes another casualty of the margin compression that efficiency-blind operators couldn’t escape.
The $1.2M Question Answered
The blog title promised an answer to the $1.2M foundry asset decision. Here it is:
For mid-sized foundry operating 3 furnaces over 15-year lifecycle:
- Investment: ₹1.1 crore ($132,000) fleet modernization
- Energy savings alone: ₹2.7 crore ($324,000) over 15 years
- Productivity gains: ₹1.05 crore ($126,000) from 30% faster cycles
- Quality premiums: ₹67.5 lakh ($81,000) from premium market access
- Total 15-year value creation: ₹4.43 crore ($531,000)
Net gain: ₹4.43 crore value minus ₹1.1 crore investment = ₹3.33 crore ($399,000) net benefit = 303% ROI
The ₹1.1 crore “cost” isn’t an expense,it’s a ₹4.43 crore investment in competitive viability that compounds advantages every tonne you melt for 15 years.
Your Path Forward Starts With Measurement
Step 1: Deploy monitoring across all furnaces (₹50K-₹1L investment, 90-day baseline)
Step 2: Measure YOUR facility’s actual SEC by furnace,data beats assumptions every time
Step 3: Identify worst performers using data, not age (replace furnace with SEC 892, not the oldest)
Step 4: Build CFO-ready business case with facility-specific waste quantified: “Furnace 1 wastes ₹18L annually”
Step 5: Phase replacement strategy,40% year 1 (prove ROI), 40% year 2 (self-funded), 20% year 3 (complete)
By 2028, your entire operation achieves 625 kWh/tonne while competitors still burning 850 kWh/tonne wonder how you’re winning automotive OEM contracts they pioneered.
The foundries that thrive in the next decade aren’t the ones with newest equipment,they’re the ones that measured SEC, invested strategically, and compounded efficiency advantages every single tonne they melted.
FAQs
1. Our foundry has 5 furnaces ranging from 10-20 years old. Should we replace all at once or phase it?
Phase replacement strongly recommended: (1) Smooth CapEx, ₹30-40 lakh/year × 3 years vs. ₹1.1 crore year 1 eases CFO approval. (2) Prove ROI with Phase 1 before full commitment, use first 40% replacement savings to self-fund remaining 60%. (3) Production continuity, replacing all furnaces simultaneously creates unacceptable delivery risk. (4) Team learning curve, operations master new IGBT technology gradually.
2. We’re getting conflicting vendor claims about efficiency improvements (25% vs 35% vs 40%). How do we know real savings?
Deploy asset-level SEC monitoring BEFORE purchasing decision to establish irrefutable baseline. Invest ₹50K-₹1L in current transformers + power meters measuring actual kWh consumption per furnace integrated with production data (tonnes melted per shift). Run 90 days capturing variability across alloy mixes, charge sizes, seasonal patterns. Result: “Furnace 1 actual SEC: 892 kWh/tonne, Furnace 2: 712 kWh/tonne, Furnace 3: 645 kWh/tonne”, now vendor claims become contractually verifiable.
3. What’s realistic payback period for furnace replacement in our foundry’s situation?
Depends critically on value streams captured: (1) Energy only (commodity casting foundries serving general industrial markets): 25-37 months per verified BEE case studies. (2) Energy + productivity (foundries with capacity constraints where 30% faster melting enables throughput expansion): 20-24 months. (3) Energy + productivity + quality premiums (aerospace/automotive tier-1 foundries with 5-15% price premiums for high-purity metals): 18-21 months.
4. Can we finance furnace replacement or do we need all cash upfront?
Equipment financing common and attractive for foundry induction furnace upgrades. BEE IGBT project example: 70% debt financing at 10% interest with DSCR 1.83 (very healthy debt service coverage). This means ₹26.29 lakh project financed with ₹18.4 lakh debt + ₹7.9 lakh equity vs. ₹26.29 lakh all-cash requirement. Effective equity requirement: 30% of gross project cost with 70% debt standard for bankable energy efficiency projects.
5. Our SEC is 780 kWh/tonne. Is that good enough or should we still consider upgrading?
780 kWh/tonne is middle-performing (between 625 best-in-class and 900 inefficient). Whether to upgrade depends on competitive context: (1) If serving automotive OEMs increasingly requiring ISO 50001, you’ll need continuous improvement trajectory toward best-in-class benchmarks, 780 today, target 625 within 5 years. (2) Your 25% energy disadvantage (780 vs 625 = 155 kWh/tonne gap) translates to ₹12 lakh annual competitive handicap per 1,000 tonnes monthly = ₹1.8 crore over 15 years.
6. What if we invest ₹90 lakh in new furnaces then raw material costs spike or customer orders drop, won’t we regret the investment?
Energy efficiency investments remarkably resilient to external shocks: (1) Efficiency advantage persists regardless of absolute cost levels, if electricity rises 20%, you’re still burning 35% less than competitors. (2) Productivity and quality benefits (30% faster cycles, premium market access) exist independent of energy prices or production volumes. (3) Historical reality confirms: industrial electricity prices rarely decrease long-term; they fluctuate upward over decades.
7. What’s first step for foundry that hasn’t measured SEC per furnace and doesn’t know where to start?
Deploy comprehensive asset-level energy monitoring immediately as foundational step (₹50K-₹1L investment, 90-day baseline). Install current transformers + power meters on each induction furnace measuring real-time kWh consumption with 1-second granularity. Integrate monitoring with production ERP/MES to capture tonnes melted per shift automatically. System calculates SEC per furnace continuously: kWh consumed ÷ tonnes produced = SEC per asset.
8. How much does a modern IGBT induction furnace actually cost for mid-sized foundries?
Verified India market pricing (2024-2025): 500 kg-1 tonne capacity (150-250 kW): ₹12.7 lakh ($15,250), 2-3 tonne capacity (350-500 kW): ₹26-30 lakh ($31,000-$36,000), 5-10 tonne capacity (800-1500 kW): ₹64-100 lakh ($77,000-$120,000). Typical mid-sized foundry fleet investment: 3 furnaces (2 tonne capacity each) = ₹90 lakh + cooling systems (₹8L) + electrical infrastructure (₹7L) + installation (₹5L) = ₹1.1 crore total fleet modernization.
9. Why is 625 kWh/tonne considered “best-in-class” SEC for foundries?
Industry benchmarking shows 625 kWh/tonne achievable with modern IGBT furnaces + real-time monitoring + optimized operations. This represents: total electrical energy required to produce one tonne of molten metal ready for casting, includes melting energy + holding furnace + power factor losses + auxiliary cooling systems. BEE documented case studies consistently show 550-650 kWh/tonne SEC for upgraded IGBT installations, making 625 kWh/tonne realistic best-practice target for well-managed operations.
10. What happens to compressed air leaks in foundries, are they really that expensive?
Single 1/4″ compressed air leak costs ₹11.1 lakh/year ($17,000) at 100 psi pressure. Typical foundry reality: 20-30% of compressor output lost to leaks across pneumatic tools, actuators, aging hoses, quick-connect fittings. Dozens of simultaneous leaks, each individually small, collectively massive, combined annual waste: ₹20-40 lakh for mid-sized operation. Completely invisible without ultrasonic leak detection; inaudible in noisy foundry environment.
11. Can we achieve 18-month payback like the blog title suggests, or is that unrealistic?
18-month payback achievable but requires capturing all three value streams, not just energy: (1) Energy savings (60% of total ROI), (2) Productivity gains (25% of ROI from 30% faster melting cycles), (3) Quality premiums (15% of ROI from premium market access). Verified recycling operation serving aerospace/automotive tier-1/medical devices documented 18.5-month payback by capturing energy + productivity + quality benefits. Foundries producing commodity castings should expect 25-30 month paybacks from energy alone, still excellent ROI, but realistic.
12. How does monitoring pay for itself before the furnace upgrade happens?
Monitoring (₹50K-₹1L investment) pays for itself in first 60 days identifying quick wins: (1) Compressed air leaks: ₹3-8 lakh annual savings from fixing 15-30 leaks, (2) Idle equipment waste: ₹8-12 lakh annual savings from automated shutdowns during non-production, (3) Power factor penalties: ₹2-5 lakh annual savings from identifying reactive power waste. Total: ₹13-25 lakh annual savings from monitoring-enabled quick wins before spending ₹90 lakh on furnace replacement.