Key Takeaways
- CCTS shifts compliance from energy consumption to emissions intensity, which means fuel switching now generates direct credits
- FY 2023-24 baseline year closed March 31, 2024, so facilities without documented data face stricter industry benchmarks
- Revenue opportunity spans four streams: carbon credits at ₹2-3 crore, energy savings of 20-30%, penalty avoidance of ₹1.12 crore, and CBAM tariff savings of ₹72-90 lakhs annually
- PAT Cycle II’s 51% purchase rate and oversupply crisis taught CCTS designers to use annual cycles and 2x penalty mechanisms
- Real-time monitoring delivers 4x better performance with 20-30% savings compared to annual audits at 5% savings
- Infrastructure serves five purposes: CCTS compliance, PAT reporting, ISO 50001, CBAM readiness, and predictive maintenance
- 30-60 day deployment timeline means facilities can still capture second half of FY 2025-26 compliance cycle
- Hardware-agnostic platforms integrate with existing SCADA and PLCs at ₹40-80 lakhs versus ₹2-3 crore greenfield alternatives
It’s 11:17 PM on a Tuesday in October 2025, and Rajesh Mehta, VP of Operations at a 1.2-million-tonne cement facility in Coimbatore, is staring at quarterly financials that don’t add up.
His plant has been a PAT compliance champion for a decade. Three cycles completed, eight point six seven million tonnes of oil equivalent saved, ESCerts traded at floor prices. The BEE plaques on his office wall prove it.
But tonight, buried in Line 47 of the energy expense report, there’s a ₹30 lakh gap between budgeted and actual costs. Then he sees the email from the group CFO, forwarded at 6:43 PM with just two words: “Explain this.”
What Rajesh doesn’t know yet is that the baseline year for India’s new carbon compliance regime closed seven months ago. While he was optimizing kilns and chasing PAT targets, the rules changed from energy consumption to emissions intensity, from 3-year cycles to annual compliance, from ESCerts to Carbon Credit Certificates.
The difference between understanding this transition and missing it comes down to real money. For his facility alone, that’s ₹1.12 crore in penalties or ₹2.4 crore in new revenue streams.
Here’s what just changed in India’s ₹48,000 crore carbon market, and why the next 90 days determine which side of that equation you’re on.
The Regulatory Earthquake: What PAT Didn’t Measure (And Why It Now Matters)
For a decade, Indian manufacturers optimized for one metric: Specific Energy Consumption. Kilowatt-hours per tonne. Megawatt-hours per unit output. The PAT scheme rewarded facilities that squeezed more production from less electricity.
But PAT had a blind spot the size of India’s industrial carbon footprint.
The Coal-to-Solar Paradox
Think of a steel plant burning coal to generate steam. Total energy consumption runs at 850 kWh per tonne of output. SEC performance looks excellent, and PAT credits get earned.
Now that same plant switches 20% of its energy mix from coal-fired electricity to solar. Total energy consumption stays at 850 kWh per tonne. Production efficiency remains unchanged, but under PAT rules there’s zero additional benefit because the kilowatt-hours stayed constant.
Under the new Carbon Credit Trading Scheme, that fuel switch drops Greenhouse Gas Emissions Intensity by 3-5% instantly. Same kilowatt-hours consumed, fewer tonnes of CO₂ equivalent released, and that generates direct credits.
PAT asked how much energy you used. CCTS asks how much carbon that energy created.
What Changed on October 8, 2025
India’s Bureau of Energy Efficiency notified GEI methodology rules for 282 obligated entities across nine sectors. These include cement, iron and steel, aluminum, fertilizers, thermal power, textiles, pulp and paper, chlor-alkali, and petrochemicals.
The compliance math shifted fundamentally.
PAT measured Specific Energy Consumption as total energy in kilowatt-hours divided by output in tonnes. CCTS measures GEI by adding Scope 1 and Scope 2 emissions in tonnes of CO₂ equivalent, then dividing by output in tonnes. Scope 1 captures direct emissions from fuel combustion while Scope 2 covers indirect emissions from purchased electricity, both weighted by Global Warming Potential.
The timeline is tighter than most manufacturers realize. The baseline year was FY 2023-24, which closed on March 31, 2024. The first compliance cycle runs through FY 2025-26 with targets of 1-3% reduction. Verification must happen by July 31, 2026, and credit trading or penalty payment comes due December 31, 2026.
The ₹100 Crore Opportunity: Four Revenue Streams From One Infrastructure
Most coverage frames CCTS as carbon credit revenue. That’s only 25% of the story. The real value stack has four layers, and companies deploying monitoring infrastructure now capture all of them.
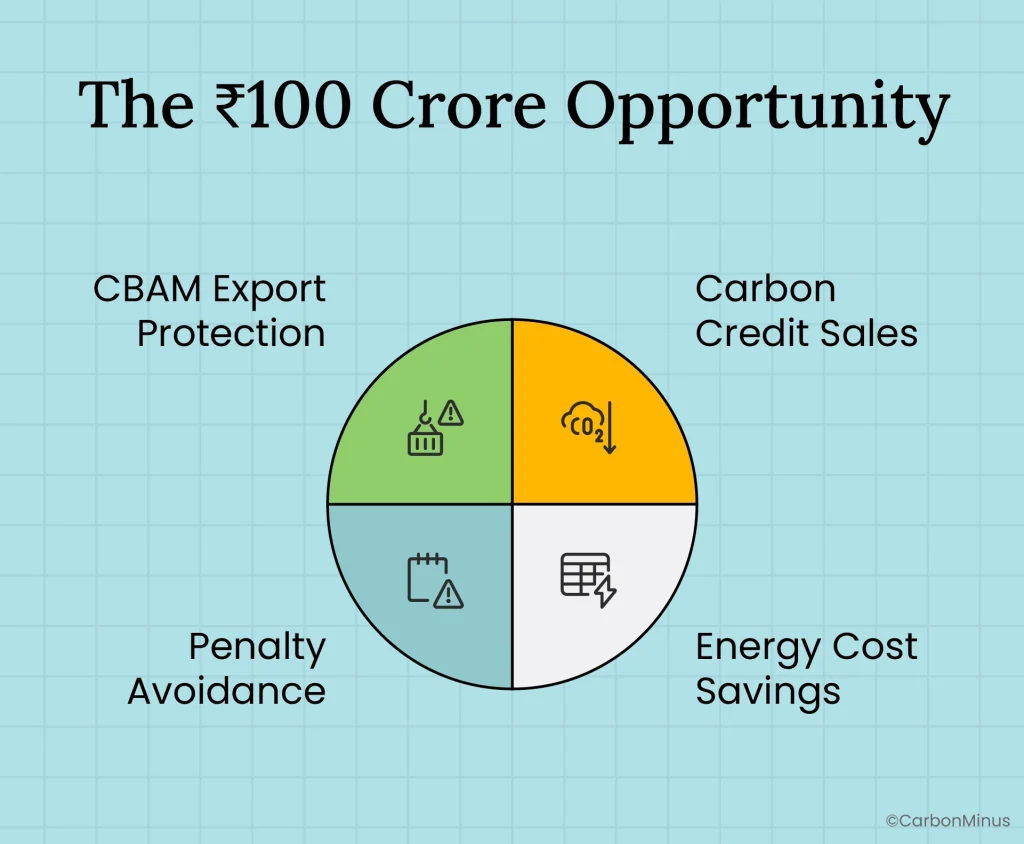
Stream 1: Carbon Credit Sales
Here’s a concrete example from cement manufacturing. Take a plant with one million tonnes of annual production capacity. The baseline GEI from FY 2023-24 sits at 0.62 tCO₂e per tonne of cement. The Phase 1 target demands a 3.4% reduction, bringing the target down to 0.605 tCO₂e per tonne.
Through process optimization combined with renewable integration, the plant achieves 0.589 tCO₂e per tonne. That’s 1.1% better than the target, creating 11,000 surplus tCO₂e credits. At ₹900 per tCO₂e, annual credit revenue reaches ₹99 lakhs.
Now scale that across sectors. Conservative sector-wide math assumes only 30% of facilities overperform their targets:
| Sector | Phase 1 Facilities | Overperformers (30%) | Est. Annual Credit Value |
| Cement | 186 | 56 | ₹31.2 crores |
| Aluminum | 13 | 4 | ₹5.2 crores |
| Pulp & Paper | 53 | 16 | ₹12.7 crores |
| Chlor-alkali | 30 | 9 | ₹9.1 crores |
| Total (282 facilities) | 282 | 85 | ₹58+ crores |
These numbers are conservative because they assume only 30% overperform and credits trade at ₹900. Current voluntary markets show ₹1,000-1,500 for verified industrial credits.
Stream 2: Energy Cost Savings
Here’s what PAT’s aggregate numbers obscured. Facilities doing annual audits achieved 5% energy savings. Facilities with real-time monitoring achieved 20-30%.
Why does performance differ by a factor of four? Manual audits identify static inefficiencies once yearly. Real-time monitoring catches dynamic waste daily, like compressed air leaks during night shifts, chillers running at full capacity during low-production hours, and transformers operating at suboptimal power factors.
A Pune automotive manufacturer provides real proof. They deployed 1,000 IoT sensors across a 34-month baseline period. The monitoring discovered their compressed air system alone was consuming 35% above necessary levels. After fixing leaks and optimizing pressure, they eliminated 163,320 kWh annually.
Their overall energy reduction hit 15-20%. On a ₹50 crore annual energy spend, that translates to ₹7.5-10 crore saved. This money is completely separate from carbon credits. The same monitoring infrastructure delivers both benefits.
Stream 3: Penalty Avoidance
CCTS penalties work at 2x the average market price for any shortfall credits.
Calculate your exposure this way. Take a 1M tonne cement facility with 1% underperformance below target. The shortfall equals 6,200 tCO₂e. If market price sits at ₹900 per tCO₂e, the penalty rate doubles to ₹1,800 per tCO₂e. Total penalty reaches ₹1.12 crores.
Payment must happen within 90 days to the Central Pollution Control Board. The critical detail matters here. Those funds go to CPCB, which means you cannot reinvest them in energy efficiency improvements.
For a corporate group with 10 facilities, penalty exposure climbs to ₹11.2 crore if baseline data isn’t audit-ready.
Stream 4: CBAM Export Protection
Europe’s Carbon Border Adjustment Mechanism requires product-level carbon intensity reporting starting 2026 for exports of steel, cement, aluminum, fertilizers, and hydrogen.
The tariff math works like this. EU carbon prices sit at €79.68 per tonne CO₂, which equals about $87 USD. Indian facilities without verified GEI data pay the full tariff. For 100,000 tonnes of annual cement exports, that creates ₹72-90 lakhs in annual tariff costs.
The strategic advantage emerges because CCTS monitoring infrastructure generates CBAM-compliant data automatically. Same sensors, same MRV verification process, just different reporting formats.
Total 3-Year Value Stack for a ₹50 Crore Annual Energy Spend Facility:
- Operational savings: ₹30 crores
- Carbon credits: ₹6-9 crores
- Penalty avoidance: ₹3.4 crores
- CBAM tariff savings: ₹2.2 crores
- Combined value: ₹41.6-44.6 crores
- Infrastructure investment: ₹40-80 lakhs
- ROI: 52-55x over 3 years
The 51% Problem: What PAT II’s Failure Teaches About CCTS
Before assuming CCTS will repeat PAT’s success, examine what happened in PAT Cycle II.
PAT’s Hidden Collapse
PAT Cycle I from 2012-15 showed impressive results. The scheme saved 8.67 MTOE, which beat the target by 30%. Total savings reached ₹9,500 crore. ESCerts traded and compliance got achieved.
PAT Cycle II from 2016-19 tells a different story. The system issued 57 lakh ESCerts but only needed 36.68 lakh for compliance. That created an oversupply of 55%.
What happened to trading volume? Only 51% of obligated entities actually purchased ESCerts. Floor price trading locked in at ₹1,840 per ESCert because supply massively exceeded demand.
Translation: the market mechanism broke down. Despite ₹9,500 crore in aggregate savings, only ₹100 crore actually got traded.
Three Design Flaws CCTS Specifically Addresses
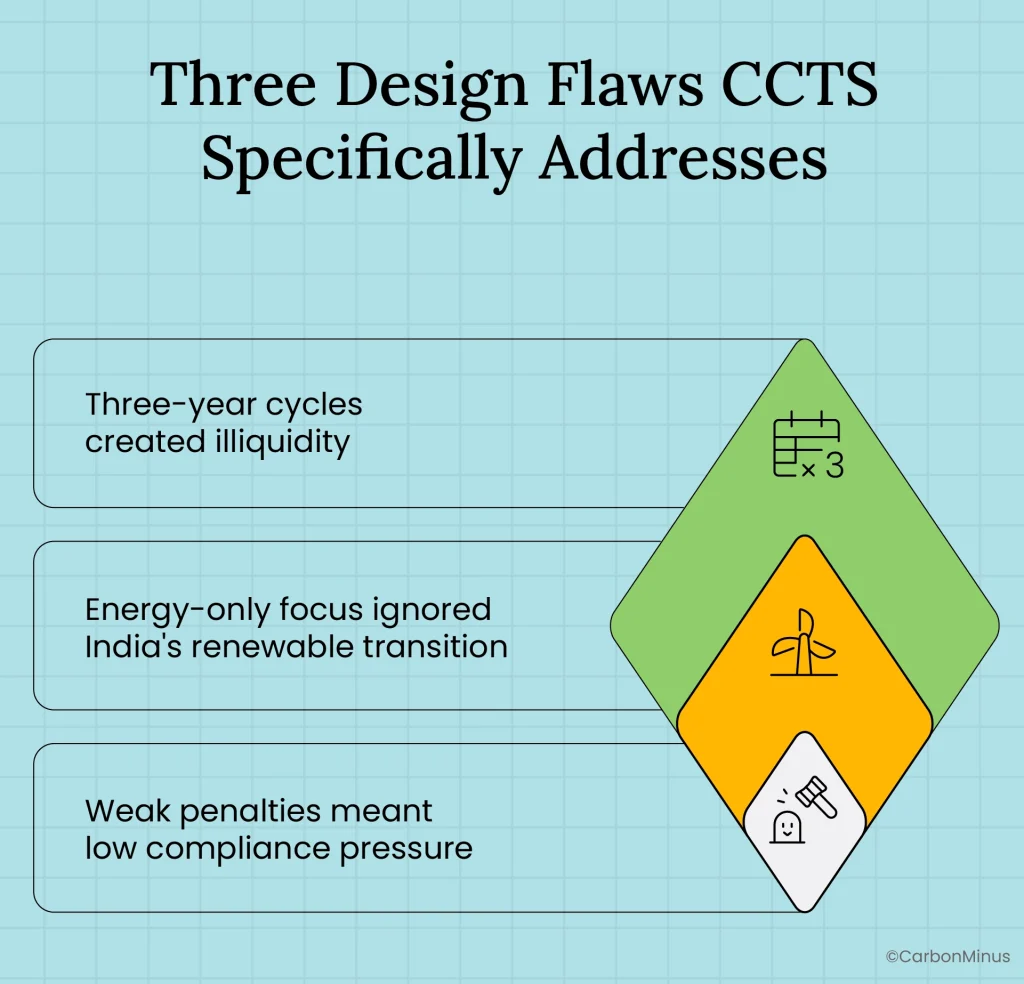
Flaw 1: Three-year cycles created illiquidity
PAT bundled compliance into 3-year blocks. Credits got generated in Year 3, traded in Year 3, then a gap opened before the next cycle. This limited temporal trading opportunities and kept market velocity low.
CCTS fixes this with annual cycles aligned to financial years. Trading windows open every 12 months and banking gets allowed between cycles. This creates continuous market activity.
Flaw 2: Energy-only focus ignored India’s renewable transition
PAT measured total kilowatt-hours without considering the carbon intensity of those kilowatt-hours. As India’s renewable energy capacity expanded 400% since 2014, PAT provided zero credit for fuel switching.
CCTS fixes this because GEI methodology directly rewards renewable adoption. Every tonne of coal-fired electricity replaced with solar creates a measurable GEI reduction.
Flaw 3: Weak penalties meant low compliance pressure
PAT penalties roughly equaled credit purchase costs at floor price. No strong financial incentive existed to overperform.
CCTS fixes this with 2x market price penalties that create genuine compliance urgency. Overperformance becomes profitable instead of just meeting the target.
The October 2025 Timing Problem: Why 60% of Facilities Are Already Behind
Here’s the compliance catch that’s trapping operations teams. Rules got notified on October 8, 2025. The baseline year closed on March 31, 2024.
That means seven months existed where compliance data needed to be collected before the compliance rules even got published.
Two Plants, Two Outcomes
Plant A: Reconstruction Scramble
A cement manufacturer with 1.2M tonne capacity heard about CCTS when the October 2025 notification came out.
They hired consultants to reconstruct FY 2023-24 emissions from shift logs, utility bills, and SCADA archives. Manual data compilation takes 3 weeks per quarter for FY 2025-26 compliance. When third-party audits happen, qualification notes get issued due to partial data gaps.
The outcome means they pass minimum compliance threshold and avoid penalties. But they have zero credit eligibility because they cannot prove overperformance without continuous monitoring. The 3-year opportunity cost reaches ₹41+ crores in foregone savings, credits, and contract premiums.
Plant B: Instrumented Advantage
A Pune automotive component manufacturer deployed real-time monitoring in FY 2022-23 for ISO 50001 certification.
Their infrastructure includes 1,000 IoT sensors across electrical, compressed air, HVAC, and water systems. Automated data logging happens at 15-minute intervals with timestamps and verification. They documented a complete 34-month baseline before GEI rules even got published.
The outcome looks completely different. They achieved ISO 50001 certification with zero audit qualifications. They discovered and eliminated 163,320 kWh of annual waste in compressed air alone. Overall energy reduction hit 15-20%. Their GEI overperformance is documented and credit-ready.
Three-year value creation reaches ₹142+ crores against an infrastructure cost of ₹65 lakhs. That delivers 218x ROI with a 5-month payback.
The infrastructure difference matters because Plant B wasn’t built for CCTS compliance. They built it for operational visibility, and CCTS compliance became a byproduct of having good data.
Beyond Compliance: Why CFOs Approve This As Operational Infrastructure
The sustainability investment framing kills budget proposals. Think of this differently. This is operational intelligence infrastructure that happens to generate compliance reports as a side benefit.
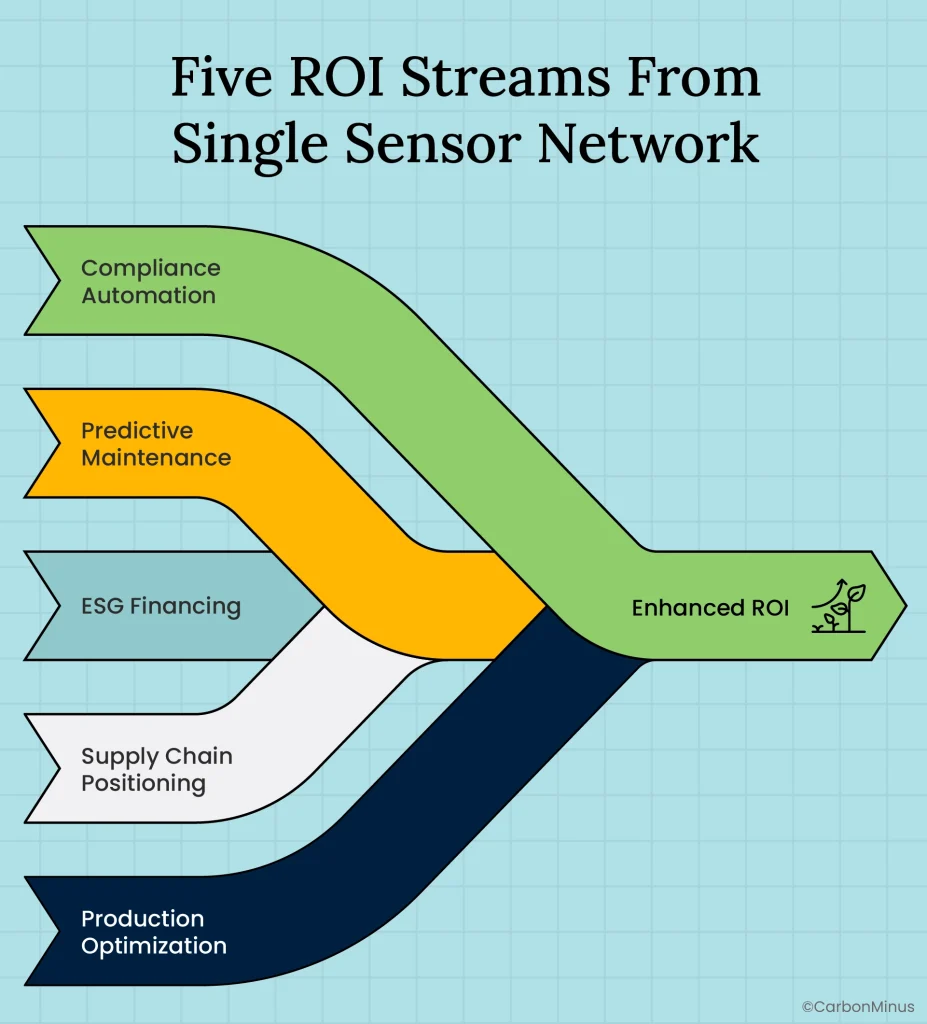
Five ROI Streams From Single Sensor Network
1. Compliance Automation
The old way took 3 weeks for manual data compilation, done 4 times per year, which adds up to 12 weeks of annual staff time. The new way generates 2-hour automated reports for PAT, CCTS, ISO 50001, and CBAM. That frees up ₹38-40 lakhs worth of engineering capacity.
2. Predictive Maintenance Integration
Energy consumption patterns flag bearing wear, DOE motor degradation, and heat exchanger fouling before catastrophic failure happens. This cuts emergency repairs by 70-75% and reduces unplanned downtime by 14%. The value over 3 years ranges from ₹2.5-8 crores in extended asset life.
3. ESG-Linked Financing Access
Sustainability-linked loans require audit-ready emissions data. Having this data makes capital available 50-75 basis points cheaper. On ₹500 crore of debt, that’s ₹2.5 crore in annual interest savings.
4. Supply Chain Positioning
ISO 50001 certification is now contractually required by European OEM exporters. Certification demands a 34-month energy baseline, which the infrastructure provides automatically. That protects ₹20-200 crore in contract retention.
5. Production Optimization
Shift-level GEI benchmarking reveals which teams, processes, and times perform most efficiently. You can schedule high-emission processes during renewable energy availability hours. You get life cycle costing data for procurement decisions. This drives ongoing 6-15% operational margin improvement.
Here’s a real example. A Fortune 500 chemical manufacturer implemented sensors for PAT and discovered their compressed air system was consuming 35% above specification. Fixing leaks and optimizing pressure saved ₹1.2 crore annually. That saving was completely independent of carbon credits.
The sensors don’t just measure emissions. They become your facility’s nervous system for detecting inefficiencies, predicting failures, and optimizing operations around the clock.
The 90-Day Choice: Two Scenarios For Your Facility
FY 2025-26 compliance cycle is already underway. The verification deadline hits on July 31, 2026. Every month of delay erases credit generation potential.
Scenario A: Reactive Compliance
You face ₹1.12 crore penalty exposure per 1M tonne facility. Staff spend 12 weeks annually on manual reporting. You generate zero carbon credit revenue. CBAM export tariffs cost ₹72-90 lakhs annually. Meanwhile competitors build 20-30% cost advantages while you audit spreadsheets.
Scenario B: Strategic Asset Management
You generate ₹2-3 crore in annual credits with proper documentation. Compliance reporting takes 2 hours instead of weeks. Real-time visibility drives 20-30% operational savings. You have CBAM-ready product carbon footprints. The 3-year ROI reaches 218x.
The infrastructure reality looks manageable. Hardware-agnostic platforms integrate with existing SCADA, PLCs, and metering systems without requiring replacement. Deployment takes 30-60 days during nights and weekends with zero production disruption.
The difference between these scenarios isn’t technology complexity. The difference is deployment timing.
What Happens Next
India’s carbon market is projected to reach $10 billion by 2030, expanding from $4.17 billion in 2025. The 282 facilities transitioning to CCTS in Phase 1 will expand to 461 in Phase 2. Targets will increase from 1-3% to 2-8% reduction.
Facilities deploying monitoring infrastructure now aren’t just achieving compliance. They’re banking credits during early cycles when targets are achievable, which positions them for price arbitrage as targets tighten and credit values rise.
Facilities waiting for more clarity are constructing a penalty liability on their balance sheets that CFOs will discover during Q4 FY 2025-26 reviews.
Your FY 2023-24 baseline is already set while the compliance clock is ticking. The only variable you still control is whether you’re measuring what matters.
Calculate your facility’s GEI baseline position and credit potential. CarbonMinus’s platform delivers compliance-ready reporting, deploying in 30 days with hardware-agnostic integration.
FAQs
Yes, but you’ll be assigned an industry benchmark baseline that’s typically 5-10% stricter than facility-specific baselines. This makes credit generation harder and increases penalty risk. Facilities with documented baselines have significant competitive advantage.
During the transition, facilities can earn both. PAT cycles continue for existing obligated entities while CCTS phases in. This creates a time-limited opportunity to generate dual credits from single efficiency improvements.
Two times the average market price of Carbon Credit Certificates for the shortfall volume. At ₹900 per tCO₂e market price, penalties cost ₹1,800 per tCO₂e. Payment must happen within 90 days to CPCB.
CCTS uses the same MRV methodology that EU CBAM requires. Infrastructure deployed for CCTS automatically generates CBAM-compliant product carbon footprints, which avoids ₹72-90 lakh annual tariff exposure for typical exporters.
Hardware-agnostic platforms cost ₹40-80 lakhs for mid-sized facilities with 1M tonne capacity. With energy savings of 20-30%, credit revenue of ₹2-3 crore, and penalty avoidance of ₹1.12 crore, documented payback periods range from 5-18 months.