Key Takeaways
- Poor power quality reduces equipment lifespan by 30%,transformers, motors, and VFDs age 4.5-9 years faster than designed, costing $34K-$94K annually in premature replacements before accounting for disruption losses
- Mid-sized foundries lose $340K+ annually from three invisible villains: voltage sags ($114K-$190K production disruptions), harmonic-induced failures ($80K-$120K equipment damage), and accelerated 30% asset degradation
- Single voltage sag costs $35K-$206K in manufacturing shutdowns,if facility experiences 10 sags/year, that’s $500K invisible annual loss blamed on “equipment problems” or “bad luck”
- Induction furnace harmonics cause transformer overheating where every 10°C temperature rise cuts lifespan in HALF,800 kW furnace study showed 6.91% THD destroying connected assets
- 80% of power quality problems originate in YOUR facility’s distribution system,not utility’s fault, meaning you control solutions through monitoring and targeted mitigation
- Hurricane Fiona proof: $2.3M equipment surge damage vs. zero loss with power-quality-managed microgrid demonstrates asset preservation value of comprehensive protection
In January 2025, astronomers using the James Webb Space Telescope discovered something remarkable: a previously unknown moon orbiting Uranus. Named S/2025 U 1, this tiny satellite,just 6 miles (10 kilometers) in diameter,had been hiding in plain sight in our own solar system for billions of years.
The discovery astonished researchers. With centuries of observation, sophisticated telescopes, and detailed mapping of our cosmic neighborhood, how could something this close remain invisible? The answer: size doesn’t determine significance, and sometimes the most important things hiding right under our noses are the hardest to see.
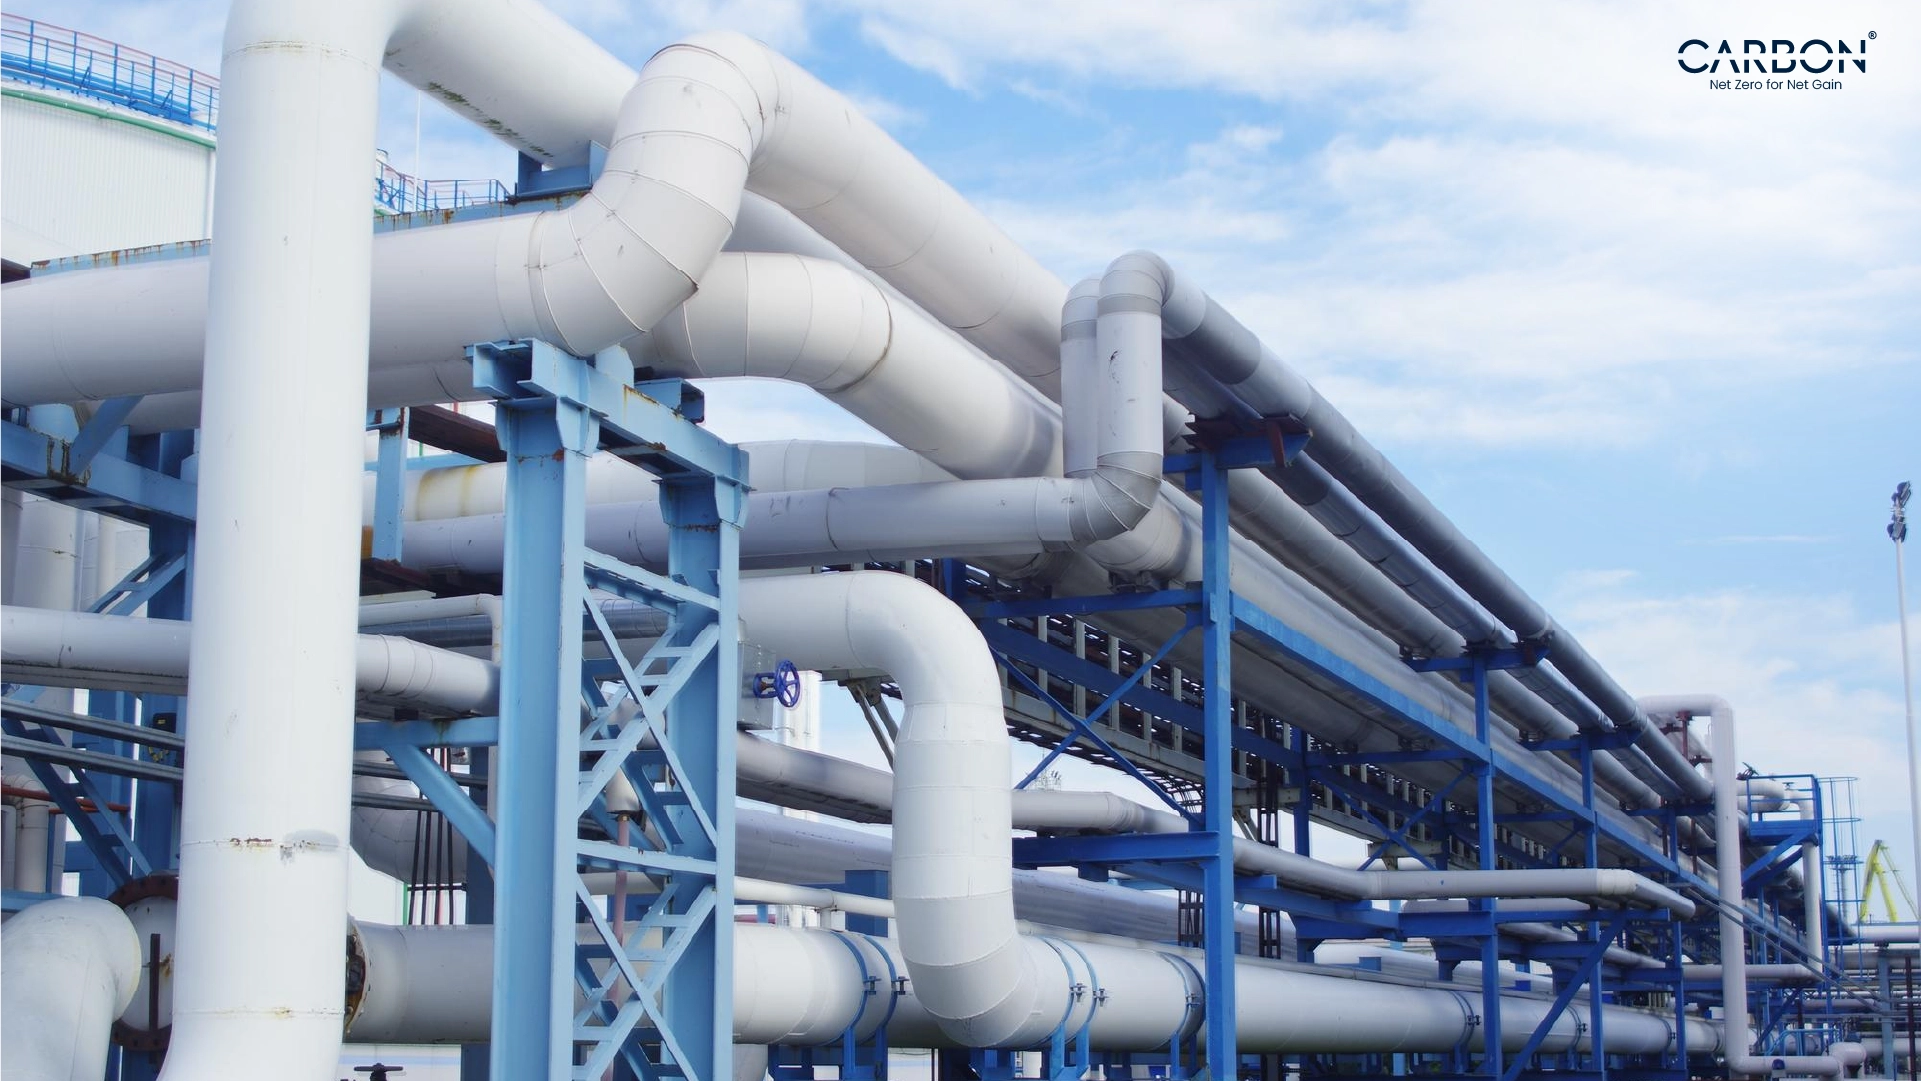
Meanwhile, in foundries across Gujarat, Maharashtra, and the American industrial heartland, maintenance directors face their own “tiny moon” problem,except what’s invisible in their facilities isn’t astronomical, it’s electrical.
September 18, 2022. Hurricane Fiona strikes Puerto Rico. Grid collapses completely. Factory A goes dark instantly,when power returns days later, catastrophe awaits: “Sensitive, multi-million-dollar equipment damaged by power surges”. Final assessment: $2.3 million loss,$800K equipment surge damage, $1.5M production loss during two-week recovery. Insurance investigation concluded: “Power quality event”.
Eight miles away, Factory B operated a 23.3 MW power-quality-managed microgrid. During Fiona: 100% uptime, zero equipment damage. Their secret wasn’t just energy independence,it was comprehensive power quality protection that most facilities don’t even know exists.
Factory A blamed the hurricane. Real culprit: invisible power quality degradation that had been slowly killing equipment for years,voltage sags, harmonics, transients operating like Uranus’s tiny moon, hiding in plain sight while systematically destroying asset value. Fiona’s surge was merely the catastrophic finale to a chronic $340K+ annual theft nobody measured.
This isn’t about weather, utility failures, or “aging equipment.” It’s about power quality silently reducing equipment lifespan 30% while maintenance teams blame bad luck,and advanced monitoring finally revealing what’s been invisible all along.
When Your $2M Equipment Base Becomes a $1.4M Investment
Research from multiple industrial power quality studies documents something maintenance directors rarely discuss: poor power quality can reduce equipment lifespan by 30%.
Not “might reduce.” Not “in extreme cases reduces.” Reduces by 30% as documented industrial reality.
The Lifespan Theft Nobody Sees
What 30% reduction means for typical foundry assets:
| Equipment Type | Design Lifespan | With Poor Power Quality | Years Stolen |
| Transformers | 25-30 years | 17.5-21 years | 7.5-9 years |
| Industrial Motors | 15-20 years | 10.5-14 years | 4.5-6 years |
| VFDs/Drives | 10-15 years | 7-10.5 years | 3-4.5 years |
| PLCs/Controls | 10-12 years | 7-8.4 years | 3-3.6 years |
| Capacitor Banks | 15-20 years | 10.5-14 years | 4.5-6 years |
These aren’t vendor scare tactics,they’re documented in industrial automation research showing $65 billion worth of assets currently reaching premature end-of-life across North American manufacturing.
The Silent Financial Hemorrhage
Scenario: Mid-sized foundry with $2M installed equipment base (3 transformers, 12 motors, 5 VFDs, 2 capacitor banks, control systems)
Without Power Quality Management:
- Equipment requires replacement 4.5-9 years earlier than designed lifespan
- Accelerated replacement cycle: $2M ÷ 12 years average = $167K annual capex
- Normal replacement cycle: $2M ÷ 17 years = $118K annual capex
- Excess annual cost: $49,000 from premature replacement alone
Plus Maintenance Escalation:
- Equipment deteriorating faster requires 20-40% more maintenance than healthy assets
- Annual maintenance budget: $150K baseline
- With power quality degradation: $180K-$210K actual
- Additional annual cost: $30K-$60K
Total Hidden Cost from 30% Lifespan Reduction: $79K-$109K annually
Over 20 years: $1.58M-$2.18M excess spending from invisible power quality degradation.
Why Nobody Connects the Dots: The Invisibility Mechanisms
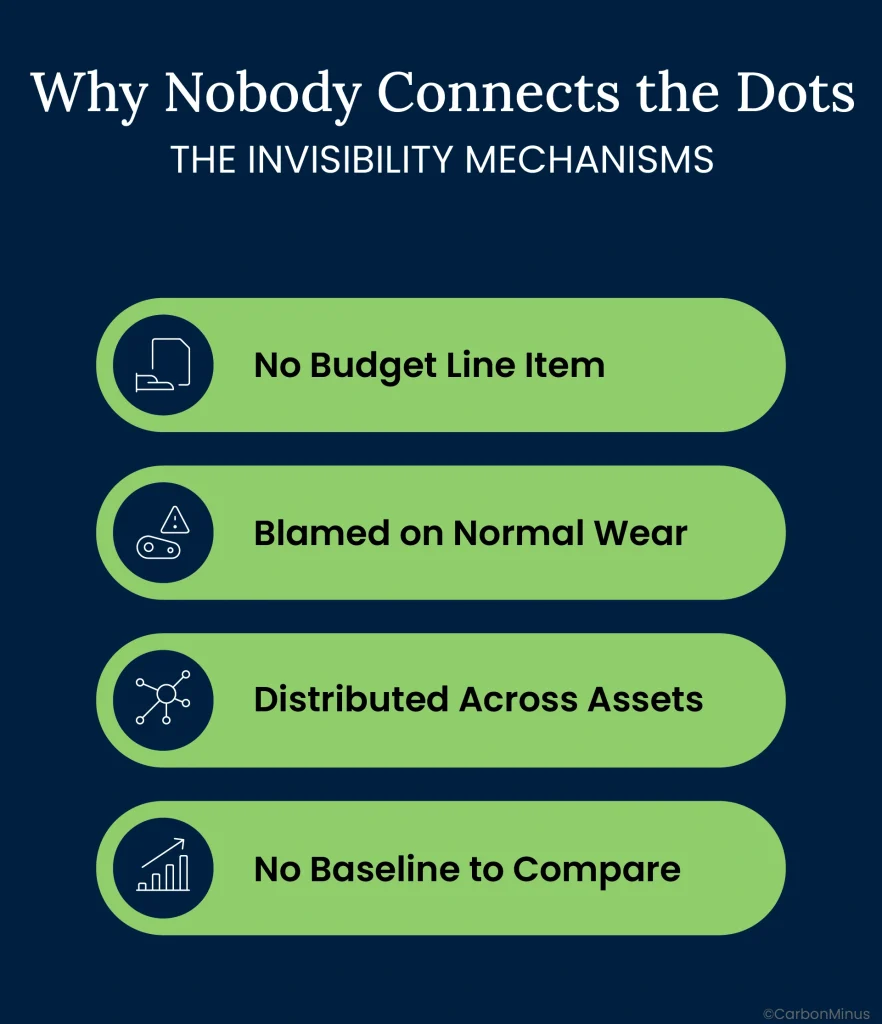
1. No Budget Line Item
“Power quality-accelerated aging” doesn’t exist in accounting systems. When transformer fails at year 12 instead of year 25, finance records: “Transformer replacement: $45,000”,not “Premature failure from 13 years power quality damage: $45,000”.
2. Blamed on Normal Wear
“Equipment’s 12 years old, time to replace” becomes accepted wisdom. Nobody questions: Should 15-year motor be failing at 11 years? Is that premature or normal?
3. Distributed Across Assets
Not single catastrophic $2M failure grabbing attention,it’s gradual death of many components over years. Three motors this year, two VFDs next year, transformer year after,each individually “explainable,” pattern invisible.
4. No Baseline to Compare
How do you know transformer failed 8 years early without measuring degradation rate? Without power quality monitoring establishing why equipment ages fast, impossible to prove causation.
The Critical Research Finding
“For every 10°C temperature rise, component experiences reduction in life by HALF in transformers”
Applied to real foundry: Harmonics from induction furnaces elevate transformer temperature 20°C above design → lifespan drops from 25 years to 6.25 years = 75% lifespan destruction. But without thermal monitoring + THD measurement, this is completely invisible until catastrophic failure.
The Three Invisible Villains Stealing $340K Annually
Like Uranus’s hidden moon, three power quality problems operate right under maintenance directors’ noses,measurable with proper instruments, catastrophic when ignored.
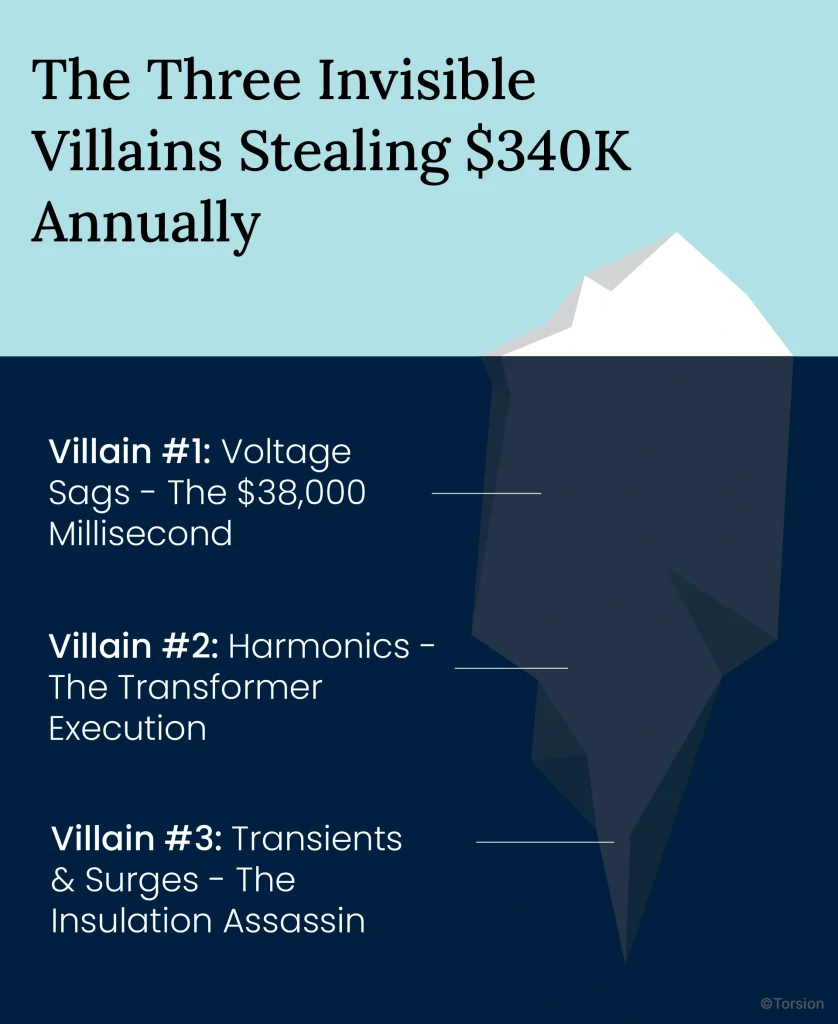
Villain #1: Voltage Sags – The $38,000 Millisecond
What They Are:
- Short-duration voltage drops: 0.5-60 cycles (8-1000 milliseconds) where voltage falls to 70-90% of nominal
- Brief but brutal: Event lasting less than one second can shut down entire production line
- Foundry-specific cause: “Voltage sag produced by induction motor starting current is one of the main causes of sensitive equipment dropout”
Why 100 Milliseconds Causes $38,000 Damage:
Equipment Impacts:
Motors (cumulative stress damage):
- Voltage unbalance from sags generates high current unbalance → additional losses, rising motor temperatures
- Each sag creates momentary high-current inrush when voltage recovers → winding heat stress
- Over time: Insulation degradation from repeated thermal cycling → premature failure
Electronic Controls (immediate dropout):
- 80% of industrial facilities: Power quality problems originate in internal distribution, not utility supply
- PLCs, VFDs, sensors: Even sags to 90% voltage for 1-2 cycles can trip devices
- #1 culprit for sensitivity: Emergency-off relays
- #2 most common: Contactors dropout during sags
- #3: Power supply to PLC/DC logic systems
The Production Cost Reality:
Industry-Specific Sag Costs (per event):
- Fine chemicals sector: €190,000 ($206,000) average single sag
- Metal processing/foundries: €35,000 ($38,000) average single sag
- Microprocessors: €100,000 ($108,000) average single sag
- Automotive industry extreme: Single 4-cycle sag = $700,000 loss (72-minute shutdown + rework)
Annual Accumulation:
- Typical industrial facility: 10-15 voltage sag events per year
- If foundry experiences 10 sags at $38K average: $380,000 annual loss
- Conservative estimate for model: 3-5 significant sags = $114K-$190K annually
North American Industrial Scale:
- Total cost of voltage sag-induced production stoppages: $250 billion per annum across all industries
- Manufacturing facilities: Single interruption costs range $4,800 to $1.2M+ depending on process type
The Attribution Problem: When production line shuts unexpectedly, investigation finds “no equipment failure”,everything tests fine after restart. Cause: voltage sag that lasted 100 milliseconds, occurred 8 seconds before shutdown, left no trace. Without waveform capture monitoring, event is invisible, blamed on “intermittent electrical glitch”.
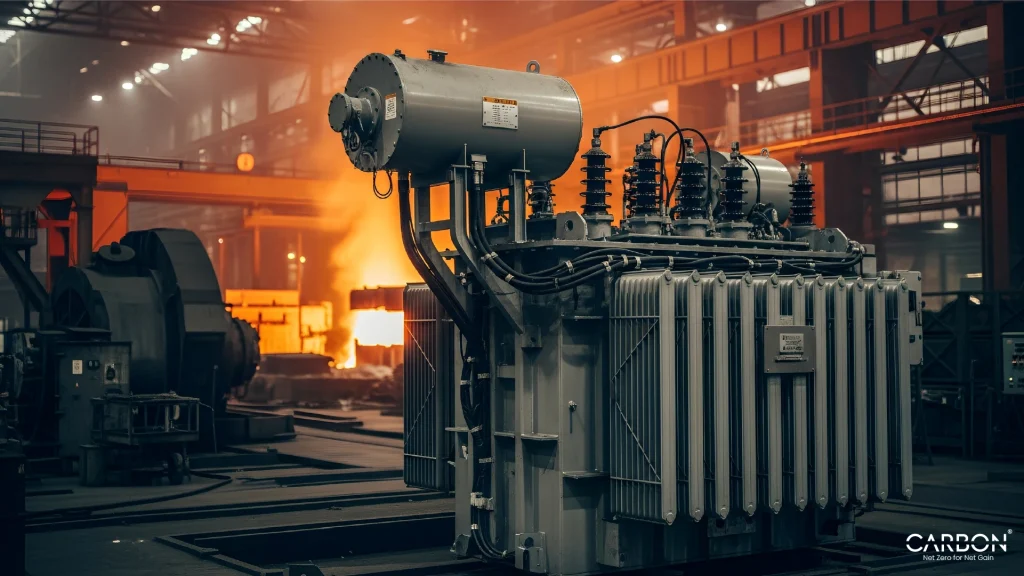
Villain #2: Harmonics – The Transformer Execution
What They Are:
- High-frequency electrical distortion: Multiples of 50/60 Hz fundamental (3rd, 5th, 7th, 11th harmonics) that deform voltage/current waveforms
- Foundry primary source: Induction furnaces using thyristor/IGBT converters for power control
- 800 kW induction furnace study: “Performance and lifespan of induction furnaces negatively affected by harmonic voltages and currents”
The Induction Furnace Harmonic Generation:
- Without compensation: Furnace operation at full load shows THD current 6.91%, THD voltage 3.23%
- IEEE 519 standard limits: Voltage THD should not exceed 5%
- Reality: Many foundries operate above limits unknowingly,no THD monitoring means no awareness
Equipment Damage Mechanisms:
Transformers (the primary victim):
Three Heat-Generating Mechanisms:
- Skin effect: Higher frequency harmonic currents concentrate at conductor surface → increased resistance → heat
- Eddy current losses: Harmonic frequencies multiply eddy current heating several times normal 60 Hz levels
- Hysteresis losses: Rate of magnetizing current polarity switching doubles (60→120 Hz for 2nd harmonic) → greater heat generation
Result: Transformer core overheating → insulation degradation → reduced lifespan
The Lifespan Mathematics:
“For every 10°C temperature rise, component experiences reduction in life by HALF in transformers”
Applied Example:
- Transformer design life: 25 years at rated temperature
- Harmonics elevate temperature 20°C above design
- Lifespan: 25 years ÷ 2 (first 10°C) ÷ 2 (second 10°C) = 6.25 years
- Result: 75% lifespan stolen by harmonic overheating
Motors (stator winding burnout):
- Additional heat and losses from harmonic currents flowing through windings
- Motor stator winding burnout documented from prolonged harmonic exposure
- Torque pulsations, reduced output, increased vibration accelerating mechanical wear
Capacitor Banks (catastrophic failure):
- Harmonic distortion elevates losses in capacitor banks used for power factor correction
- Overcurrent, overheating, premature aging → bursting, leakage, complete failure
- Harmonic resonance: When capacitor reactance matches system inductance at specific frequency → amplifies harmonics catastrophically, destroying capacitors
Cables and Neutrals (insulation degradation):
- Cable insulation degradation from continuous harmonic heating
- Triplen harmonics (3rd, 9th, 15th) add together in neutral conductor → if high enough, neutral overheats, insulation fails
The Cost Reality:
- “Power quality issues and equipment failures” directly attributed to harmonics in industrial studies
- Foundry study conclusion: “Harmonics have negative effect on power losses and temperature rise that over prolonged exposure can result in serious damage and reduce life of transformers”
- Annual harmonic damage estimate: $80K-$120K in accelerated transformer/motor degradation + $40K-$60K capacitor/protection device failures = $120K-$180K total
Villain #3: Transients & Surges – The Insulation Assassin
What They Are:
- Momentary voltage spikes: From lightning strikes, capacitor switching, equipment startup/shutdown, dirty/worn contactors
- Cumulative damage mechanism: Each transient creates stress invisible until catastrophic failure
- The insidious reality: 100th surge finally breaks what 99 previous surges weakened incrementally
Equipment Impacts:
Motors:
- Voltage transients stress motor-winding insulation → gradual degradation over time or complete breakdown
- Each surge event weakens dielectric strength slightly,cumulative effect leads to premature failure
All Connected Equipment:
- Reduced equipment lifespan: Transients create cumulative stress on components, accelerating wear across facility
- Flashover and arcing in distribution equipment from voltage spike exceeding insulation ratings
- Damaged insulation throughout electrical infrastructure
- Failed electronics: PLCs, drives, sensors particularly vulnerable to transient damage
Safety Hazards:
- Sudden malfunctions from surge-damaged equipment pose risks to operators and machinery
- Unpredictable failures during production create hazardous situations
The Hurricane Fiona Extreme Example:
- $800K equipment surge damage from violent transients during grid restoration after collapse
- “Sensitive, multi-million-dollar equipment damaged by power surges”
- This is transient damage at catastrophic scale,same mechanism operates daily at lower intensity in every facility
- Hurricane compressed 5-10 years of gradual transient degradation into days
Combined Villain Impact: $114K-$190K (voltage sags) + $120K-$180K (harmonics) + $30K-$60K (transients) + $79K-$109K (30% accelerated aging) = $343K-$539K total annual hidden cost
The $340K Accounting Invisibility
For mid-sized foundry with $2M equipment base producing 1,000 tonnes monthly, here’s where $340K hides:
The Complete Cost Breakdown
Cost Category 1: Voltage Sag Production Disruptions
- Foundry average per sag: $38,000 (metal processing industry benchmark)
- Typical annual frequency: 3-10 sag events depending on utility stability + internal equipment
- Annual cost range: $114K-$380K
- Conservative estimate: 3-5 significant sags = $114K-$190K
Cost Category 2: Harmonic-Induced Equipment Failures
- Transformer overheating/degradation: $50K-$70K annually from accelerated aging
- Motor failures from harmonic heating: $30K-$50K annually (premature stator winding burnout)
- Capacitor bank/protection device failures: $40K-$60K annually from overcurrent damage
- Total harmonic damage: $120K-$180K annually
Cost Category 3: Transient/Surge Damage
- Gradual insulation degradation: $20K-$40K annually across motors, cables, switchgear
- Electronic equipment failures: $10K-$20K annually in PLCs, drives, sensors damaged by surges
- Total transient damage: $30K-$60K annually
Cost Category 4: Accelerated 30% Asset Aging
- Premature equipment replacement: $49K annually (12-year vs 17-year average cycle)
- Increased maintenance on degrading assets: $30K-$60K annually (20-40% escalation)
- Total aging cost: $79K-$109K annually
TOTAL ANNUAL HIDDEN COST: $343K-$539K
Median: $441K | Conservative estimate: $340K (title uses conservative end of range)
Why It’s Called “The Secret”
The Accounting Disappearing Act
No Dedicated Line Item
“Power quality losses” doesn’t appear in P&L statements. Where $340K actually hides:
- Maintenance supplies (emergency motor repairs attributed to “wear”)
- Unplanned downtime (sag-induced shutdowns called “equipment failures”)
- Capex (premature replacements justified as “end of useful life”)
- Production variances (quality issues from voltage fluctuations)
Distributed Attribution
- Voltage sag costing $38K blamed on “PLC malfunction” → maintenance repairs PLC ($8K), never identifies voltage sag root cause
- Harmonic-damaged transformer appears as “normal maintenance” ($45K replacement) → nobody questions why 12-year transformer failed when rated 25 years
- Transient-weakened motor recorded as “motor burnout” ($18K) → attributed to “age” not cumulative surge damage
The Forensic Gap: Without power quality monitoring capturing time-stamped waveforms, impossible to prove causation. Hurricane Fiona’s $2.3M initially blamed on “storm damage”,forensic investigation revealed “power quality event”. How many $38K losses are misattributed yearly because no monitoring exists to document voltage sags?
The Comparative Reality
How $340K Compares to Visible Costs:
Annual Foundry Energy Bill (1,000 tonne/month at 850 kWh/tonne, ₹7.8/kWh):
- Energy cost: ₹7.96 crore ($955K annually)
Hidden Power Quality Cost: $340K = 36% of energy bill
The Optimization Paradox: Most foundries obsess over 5-10% energy efficiency gains (visible, measured monthly, celebrated when achieved),while completely ignoring 36% power quality losses (invisible, unmeasured, blamed on “bad luck”).
North American Industrial Scale: $250 billion annually lost to voltage sags alone across all industries. $340K per mid-sized facility = proportional share of massive unmeasured industrial problem.
The 80% Rule: Why This Problem Is Yours to Solve
The most empowering,and uncomfortable,power quality truth maintenance directors learn:
“80% of power quality problems originate in the company’s own distribution and grounding systems”
Not 80% contributed to. Not 80% influenced by. 80% originate internally.
What “80% Internal” Actually Means
Not Utility’s Fault:
Utility delivers reasonably clean power to your service entrance meeting ANSI/IEEE standards. The degradation happens AFTER your meter, inside your facility’s distribution system.
You’re Both Source and Victim:
- Your induction furnaces generate harmonics damaging your transformers
- Your motor starting creates voltage sags disrupting your sensitive equipment
- Your switching operations generate transients weakening your insulation
- You’re systematically destroying your own assets through equipment Investment
The Good News:
If 80% is internal, you control the solution without waiting for utility cooperation, regulatory changes, or external approvals
The Bad News:
You’ve likely been calling utility for years complaining about power quality while actual problems originated inside your fence line
The Foundry-Specific Internal Sources
Source #1: Induction Furnace Harmonics
The Generation Mechanism:
- Thyristor/IGBT power converters create non-linear loads drawing distorted current waveforms
- 800 kW furnace documented impact: THD current 6.91%, THD voltage 3.23% at full load
- “Degree of distortion influenced by melting load”,excessive distortion generates higher frequencies throughout facility
The Propagation:
Harmonics don’t stay localized at furnace,they propagate backward through distribution system affecting all equipment on shared transformer. One furnace’s harmonics damage motors, capacitors, controls across entire facility.
Source #2: Motor Starting Voltage Sags
The Physics:
- Induction motors draw 6-10x full load current during startup
- Large current draw through system impedance creates symmetrical voltage sag affecting all three phases
- “Voltage sag produced by induction motor starting current is one of the main causes of sensitive equipment dropout”
Every Furnace Startup = Facility-Wide Sag:
When a 500 HP induction furnace motor starts, voltage across the entire plant drops 10-20% for 2-6 cycles. PLCs, VFDs, contactors throughout the facility experience this sag simultaneously.
Source #3: Switching Transients
The Transient Generators:
- Capacitor bank switching: Creates voltage spike when energized
- Dirty/worn contactors: Generate arcing transients during operation
- Large equipment startup/shutdown: Sudden load changes create voltage fluctuations
Cumulative Damage:
Each transient event invisible individually,but 100 events over months/years create cumulative insulation stress leading to premature failure.
Why Utility Says “Power Is Clean”
The Measurement Location Gap:
Utility Monitors at Service Entrance:
- Power quality at meter typically meets IEEE standards
- This proves utility delivered acceptable power
Problems Occur Downstream:
- At induction furnace feeder: THD 6.91%
- At motor starter: Voltage sag to 78% during startup
- At sensitive equipment circuit: Multiple transients per hour
- Utility meter sees none of this,it’s all internal to your facility
The Realization: For 3 years we complained to the utility about power quality. They kept saying ‘power at meter is within specs.’ Now I understand,the meter IS within specs. The problems are created by our own equipment 200 feet downstream.
Why Power Quality Monitoring Is Asset Management, Not Electrical Troubleshooting
The fundamental reframing that changes everything:
The Wrong Department Owns the Problem
Traditional View:
- Power quality = electrical engineering problem
- Owned by: Facilities/maintenance department
- Measured by: Uptime, outage frequency
- Budget: Maintenance supplies line item
Why This Fails:
- Electrical team focused on “fix immediate problem,” not “protect $2M asset base”
- No visibility into cumulative financial impact ($340K annual theft)
- Competing with wrench budgets, not capital equipment protection
- Success measured by “lights stayed on,” not “equipment aging at designed rate”
Correct View:
- Power quality = asset preservation and financial management
- Owned by: Asset managers, operations directors, CFO
- Measured by: Equipment lifespan extension, avoided losses, ROI
- Budget: Capital equipment protection line item
Why This Works:
- Frames as $2M asset base protection not $50K monitoring expense
- Quantifies financial impact: $340K annual losses prevented
- Competing with asset replacement budgets,where it belongs
- Success measured by equipment aging at design rate + avoided disruptions
The Investment vs. Savings Mathematics
Power Quality Monitoring System:
- Comprehensive facility monitoring: ₹15-30 lakh ($18K-$36K)
- Includes: Multi-point waveform capture, harmonic analysis, sag/transient detection, real-time alerts, cloud analytics
- Plus targeted mitigation: ₹20-40 lakh ($24K-$48K) for harmonic filters, soft starters, surge protection
- Total system investment: ₹35-70 lakh ($42K-$84K)
Annual Savings Documented:
Category 1: Reduced Voltage Sag Disruptions:
- Soft starters + monitoring reduce sag frequency/severity 50-70%
- From 5 sags × $38K = $190K → 2 sags × $38K = $76K
- Annual savings: $50K-$114K
Category 2: Prevented Harmonic Damage:
- Harmonic filters at furnace connection reduce THD from 6.91% to < 3%
- Protects transformers from overheating (prevents 50% lifespan loss)
- Eliminates capacitor bank failures from harmonic overcurrent
- Annual savings: $80K-$120K
Category 3: Extended Equipment Lifespan:
- Mitigate power quality → recover from 30% degradation toward normal lifespan
- 12-year replacement → 15-year replacement = 25% capex reduction
- Annual savings: $40K-$70K (phased recovery over 3-5 years)
Category 4: Reduced Maintenance:
- Equipment under less stress requires 20-40% less maintenance
- $180K stressed maintenance → $150K normal maintenance
- Annual savings: $30K-$50K
Total Annual Savings: $200K-$354K
Payback Calculation:
- Monitoring only (₹15-30L/$18K-$36K) ÷ partial savings = 3-6 months payback
- Monitoring + mitigation (₹35-70L/$42K-$84K) ÷ full savings = 4-15 months payback
- Conservative estimate: 6-12 months for comprehensive system
15-Year Net Present Value:
- Investment: $42K-$84K
- Cumulative savings: $3M-$5.3M (at 10% discount rate)
- NPV: $2.92M-$5.22M
- ROI: 70-120x over equipment lifecycle
The Hurricane Fiona $2.3M Proof Point
The Natural Experiment in Asset Preservation:
Factory A (grid-dependent, no power quality protection):
- Grid collapse → violent restoration surges → $2.3M equipment damage
- “Sensitive, multi-million-dollar equipment damaged by power surges”
- Two weeks offline recovering from catastrophic surge damage
- Insurance investigation: “Power quality event”,claim denied
Factory B (23.3 MW microgrid with power quality management):
- Islanded operation during grid collapse = zero surge exposure during restoration
- 100% uptime throughout Fiona, zero equipment damage
- Captured competitors’ orders while entire island dark for weeks
- Posted highest quarterly profit margin while competitors absorbed millions in losses
The Asset Preservation Calculation:
- $2.3M protected through comprehensive power quality protection during single extreme event
- One hurricane = 5-7 years of typical $340K annual power quality losses compressed into days
- Microgrid investment justified partially on energy, partially on multi-million dollar asset insurance
The Uncomfortable Truth:
Most facilities are self-insured against $2M+ power quality catastrophe without knowing it,standard industrial insurance excludes “power quality events”
The Seven Warning Signs Your Assets Are Dying Invisibly
Maintenance directors rarely see power quality degradation directly,but they see symptoms daily.
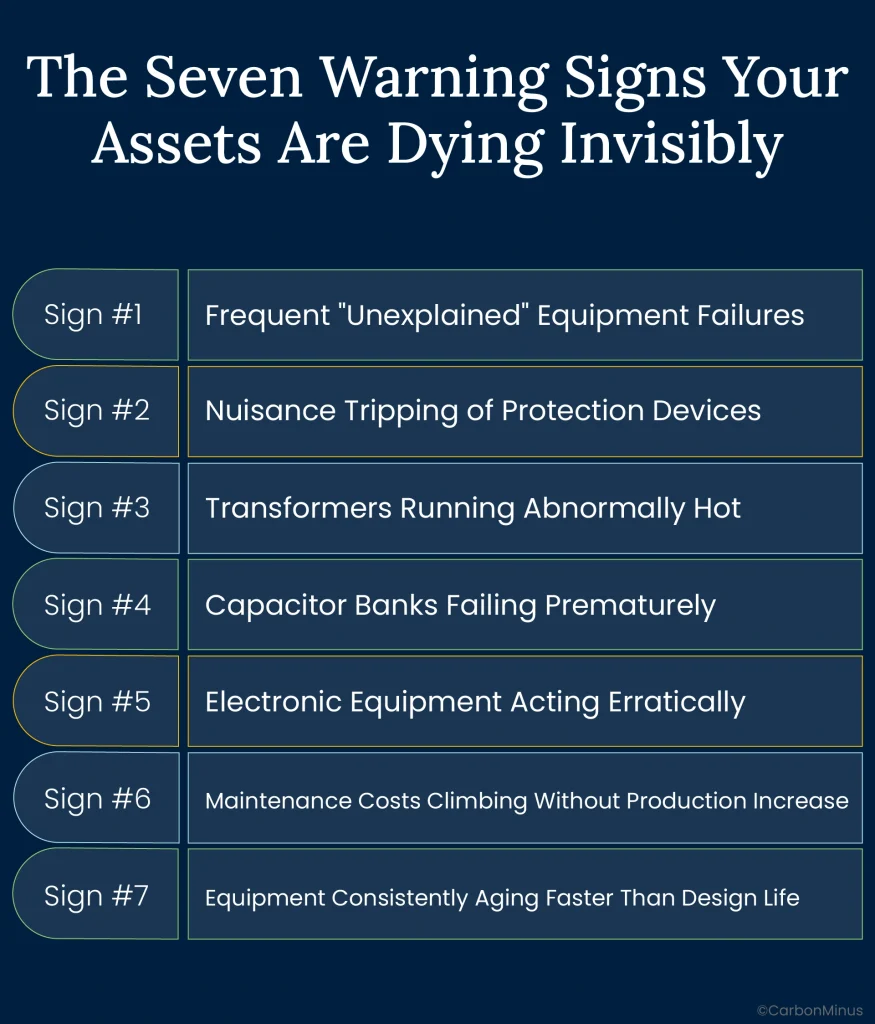
Warning Sign #1: Frequent “Unexplained” Equipment Failures
What it looks like:
- Motors burning out every 12-18 months when rated for 15-20 years
- VFDs failing at 7-8 years despite 10-15 year design life
- Transformers requiring replacement at 12-14 years instead of 25-30 years
Real cause:
- Voltage unbalance from sags overheating motor windings
- Harmonics causing transformer core losses and temperature rise
- Cumulative transient damage degrading insulation
The test: If failures cluster in same equipment type across facility (e.g., three motors in 6 months), suspect systematic power quality issue not random bad luck
Warning Sign #2: Nuisance Tripping of Protection Devices
What it looks like:
- Breakers, contactors, relays tripping “randomly” without apparent overload
- Emergency-off relays dropping out unexpectedly
- Production restarts after trip, everything tests fine, happens again next week
Real cause:
- Voltage sags during motor starting dropping below protection device trip threshold momentarily
- Transients creating momentary overvoltage triggering protective relays
The test: If trips correlate with specific equipment operations (furnace motor starting, large load switching), classic voltage sag symptom
Warning Sign #3: Transformers Running Abnormally Hot
What it looks like:
- Transformer casings noticeably warmer than identical units at sister plants
- Cooling fans running continuously even during low-load periods
- Oil temperature requiring more frequent changes than maintenance schedule
- Annual inspection detecting insulation degradation
Real cause:
- Harmonic-induced eddy current and core losses generating 20-30% excess heat
- Induction furnace harmonics propagating through distribution system
The critical knowledge:
“For every 10°C temperature rise, component experiences reduction in life by HALF”,20°C excess = 75% lifespan stolen
The test: If temperature rise correlates with induction furnace operation cycles, harmonics highly likely
Warning Sign #4: Capacitor Banks Failing Prematurely
What it looks like:
- Power factor correction capacitors bursting, leaking, overheating before rated lifespan
- Multiple capacitor failures in short timeframe (3 failures in 18 months)
- Capacitor bank protective fuses blowing frequently
Real cause:
- Harmonic overcurrent exceeding capacitor ratings
- Harmonic resonance between capacitors and system inductance amplifying specific harmonic orders catastrophically
The test: THD measurement will reveal if harmonic levels exceeding capacitor voltage/current ratings
Warning Sign #5: Electronic Equipment Acting Erratically
What it looks like:
- PLCs resetting randomly during production runs
- VFDs displaying fault codes with no identifiable cause
- Sensors providing erratic readings, requiring frequent recalibration
- Control systems requiring more frequent troubleshooting
Real cause:
- Voltage sags below operating threshold causing resets
- Transients creating momentary overvoltage damaging sensitive electronics
- Harmonic distortion interfering with low-voltage control signals
The test: If malfunctions correlate temporally with specific operations (production line starts, furnace energizes), voltage sag likely root cause
Warning Sign #6: Maintenance Costs Climbing Without Production Increase
What it looks like:
- Maintenance budget growing 10-20% annually despite flat production volume
- Increasing frequency of unplanned repairs
- Emergency maintenance becoming norm rather than exception
Real cause:
- Power quality degradation accelerating wear on all assets simultaneously
- Equipment deteriorating faster requires 20-40% more maintenance than healthy baseline
The test: If maintenance costs distributed across many equipment types (not concentrated in one area), indicates systematic facility-wide degradation typical of power quality issues
Warning Sign #7: Equipment Consistently Aging Faster Than Design Life
What it looks like:
- Assets requiring replacement at 60-75% of design lifespan consistently
- 15-year motors needing replacement at 10-11 years repeatedly
- 25-year transformers failing at 12-14 years
- Pattern across multiple equipment types over years
Real cause:
- 30% lifespan reduction from cumulative power quality stress operating continuously
- Voltage sags, harmonics, transients creating additive damage accelerating aging
The test: If replacements cluster around 70% of design life across equipment categories, power quality degradation highly probable.
From Invisible Theft to Visible Protection: Your 90-Day Implementation
Power quality monitoring implementation follows proven three-phase approach:
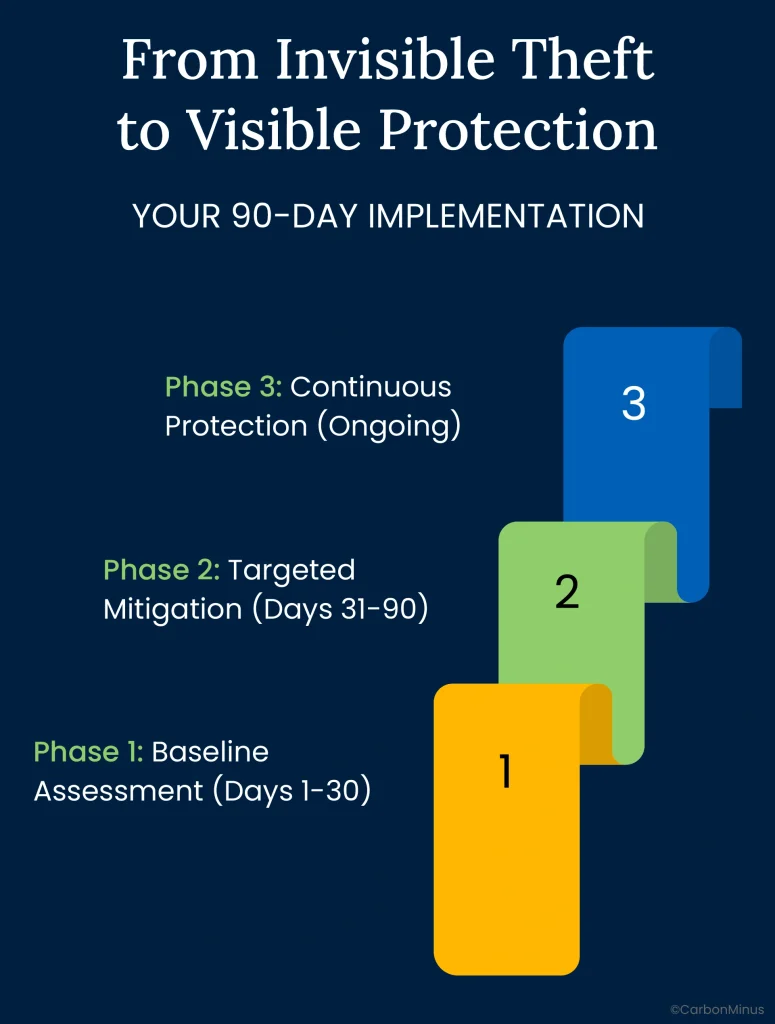
Phase 1: Baseline Assessment (Days 1-30)
Deploy Strategic Monitoring:
Critical Measurement Points:
- Service entrance: Document utility power quality, establish baseline
- Induction furnace feeders: Measure harmonic generation at source
- Large motor starters: Capture voltage sag depth/duration during startup
- Sensitive equipment circuits: Monitor PLC, VFD, control system power quality
Capture Requirements:
- Voltage sags/swells: Record depth, duration, frequency, phase affected
- Harmonics: Measure THD voltage/current, individual harmonic orders through 25th
- Transients: Capture magnitude, rate of rise, frequency
- Power factor: Continuous monitoring for utility penalty assessment
- Waveform recording: Forensic-grade data for event correlation with equipment failures
Quantify Current Losses:
Document Baseline Costs:
- Count voltage sag events: How many per month? What production impact?
- Value each disruption: Calculate actual lost production + scrap + restart labor
- Measure THD levels: Compare to IEEE 519 standards (5% limit)
- Correlate equipment failures: Match failure timestamps to power quality events
30-Day Deliverable: “Currently experiencing 4 voltage sags/month costing $38K each = $152K/month invisible loss + THD 6.8% causing transformer overheating 22°C above rated”
Phase 2: Targeted Mitigation (Days 31-90)
Address Top 3 Issues by Severity:
Issue #1: Harmonics (if THD > 5%):
- Active harmonic filters: Install at induction furnace connection point, reduce THD to < 3%
- Investment: ₹15-25 lakh ($18K-$30K) for 500-1000 kVA capacity
- Expected result: Eliminate transformer overheating, prevent capacitor failures, extend connected equipment life
Issue #2: Voltage Sags from Motor Starting (if > 3 sags/month):
- Motor soft starters: Implement reduced-voltage starting for large induction motors
- Investment: ₹8-15 lakh ($10K-$18K) for 500 HP motor starter
- Expected result: Reduce sag depth 50-70%, eliminate sensitive equipment dropouts
Issue #3: Transients (if frequent):
- Transient voltage surge suppressors (TVSS): Strategic placement at service entrance, critical equipment
- Investment: ₹5-10 lakh ($6K-$12K) for comprehensive facility protection
- Expected result: Protect insulation from cumulative surge damage, prevent catastrophic failures
Verify Effectiveness:
- Before/after measurement: Document THD reduction (6.8% → 2.9%), sag frequency decrease (4/month → 1/month)
- Quantify savings: Track reduction in equipment failures, production disruptions
- Calculate ROI: “Harmonic filter cost ₹18L, prevented 2 transformer failures ($90K) + 3 capacitor failures ($45K) = $135K savings in 6 months”
Phase 3: Continuous Protection (Ongoing)
Proactive Asset Preservation:
Early Warning System:
- Trend analysis: Identify gradual degradation requiring attention (THD creeping from 3% to 4.5% over months)
- Predictive alerts: Notification 30-60 days before equipment failure based on power quality stress indicators
- Forensic correlation: When equipment fails, determine if power quality event contributed
Expected Outcomes After 12 Months:
- 50-70% reduction in voltage sag disruptions: From $152K/month to $46K-$76K/month
- 60-80% reduction in harmonic-induced failures: From $120K-$180K annually to $24K-$72K
- Recovery toward normal lifespan: 30% degradation → 10-15% degradation (assets aging closer to design rate)
- Total documented savings: $200K-$354K annually from $42K-$84K investment
Asset Management or Electrical Problem,Who Owns Your $340K Loss?
Maintenance directors asking “Why are our transformers failing early?” are asking the wrong question.
Real question: “Is power quality systematically destroying asset value across our entire facility?”
Because 30% lifespan reduction isn’t isolated to one motor or transformer,it’s facility-wide silent theft affecting every asset simultaneously, compounding $340K losses year after year.
The $340K Secret Revealed
Blog title promised answer to power quality’s $340K secret. Here it is:
Mid-sized foundries lose $114K-$190K annually to voltage sag production disruptions,each 100-millisecond event costing $38,000 in shutdowns blamed on “equipment glitches”
Plus $120K-$180K to harmonic-induced equipment failures,transformer overheating where every 10°C rise cuts lifespan in HALF, motor stator burnout, capacitor explosions
Plus $79K-$109K from accelerated 30% asset aging,equipment replaced at year 12 instead of year 17, maintenance budgets climbing 20-40%
Total: $313K-$479K annually, median $340K
The “secret” isn’t that problems exist,it’s that nobody measures them, attributes them correctly, or owns them strategically. They hide in maintenance budgets, blamed on “aging equipment,” “bad luck,” “improper maintenance”,everything except actual systematic power quality degradation.
Your 30-Day Path to Visibility
Deploy power quality monitoring (₹15-30 lakh, $18K-$36K investment) measuring YOUR facility’s actual voltage sags, harmonics, transients for 30 days
Quantify current annual losses using industry benchmarks: $38K per sag × frequency, transformer overheating costs from 10°C/50% lifespan rule, maintenance escalation percentages
Build asset-management business case: “Protecting $2M equipment base from $340K annual degradation + potential $2.3M catastrophic surge with $42K monitoring investment = 8x first-year ROI, 70-120x over 15 years”
By 2026, your assets age at designed rates (transformers reaching 25 years, motors reaching 18 years) while competitors lose 30% lifespan wondering why maintenance budgets keep climbing,never realizing the tiny moon destroying millions in asset value has been hiding in plain sight all along.
FAQs
1. How do we prove equipment failures are power quality-caused, not maintenance negligence?
Deploy time-stamped waveform monitoring for forensic correlation. Install monitors at service entrance, furnace feeders, and sensitive equipment circuits capturing voltage sags, harmonics, and transients continuously. Example proof: Motor fails Tuesday 2:14 PM; monitoring shows voltage sag to 78% at 2:13:52 PM (8 seconds prior). Pattern matters: Five motors failing within 24 hours of sags = power quality causation.
2. Our utility says their power is clean. Why monitor internally if utility power meets standards?
Because 80% of power quality problems originate inside YOUR facility, not from utility. The reality: Utility meter shows 2% THD (within standards), but your induction furnace feeder generates 6.8% THD internally. Your motor starting creates facility-wide voltage sags; your switching generates transients damaging insulation. Good news: Since 80% is internal, you control solutions without utility cooperation.
3. Can power quality really reduce equipment lifespan 30%, or is that worst-case?
30% reduction is documented reality, not worst-case. Multiple sources confirm foundries experience transformers failing at year 12 instead of 25, motors at 11 versus 15 years, VFDs at 7 versus 10 years. Mechanism documented: “For every 10°C temperature rise, transformer lifespan reduces by HALF”. Applied: 20°C harmonic overheating drops 25-year transformer to 6.25 years = 75% reduction.
4. What THD (Total Harmonic Distortion) level is dangerous? When should we take action?
IEEE 519 limits: Voltage THD ≤ 5%, current THD ≤ 5-8%. Action thresholds: THD voltage > 5% requires immediate investigation for transformer overheating risk (10°C rise = 50% lifespan loss). THD current > 8% demands harmonic filters at induction furnaces. Real foundry example: 800 kW furnace generated 6.91% THD current, 3.23% THD voltage. Mitigation costs: Passive filters (₹8-15L), active filters (₹15-30L).
5. We’ve operated 20 years without monitoring. Why invest now?
Three critical reasons: (1) Cumulative damage accelerating, each year compounds previous damage, equipment near failure threshold now. (2) Equipment aging makes problems worse, 15-year-old assets far more sensitive to power quality stress than new equipment. (3) Modern electronics 10-100x more sensitive, new PLCs/VFDs replacing electromechanical systems vulnerable to millisecond sags. Financial reality: 20 years × $340K = $6.8M cumulative unrecognized loss.
6. Where should we install monitoring equipment and what should we measure?
Three-tier strategy: Tier 1, Service Entrance (voltage sags, THD, transients, power factor to baseline utility power). Tier 2, Critical Feeders (induction furnace feeders, large motor starters measuring current THD by harmonic order). Tier 3, Sensitive Loads (PLCs, VFDs, controls measuring voltage sag depth/duration). Investment: 3 points minimum = ₹15-20 lakh; comprehensive 8-12 points = ₹25-35 lakh.
7. What does a single voltage sag event actually cost in production disruption?
Industry-specific sag costs per event: Metal processing/foundries average $35,000-$38,000 per sag, fine chemicals sector $190,000-$206,000, automotive industry extreme case $700,000 (72-minute shutdown + rework). Typical industrial facility experiences 10-15 voltage sag events per year. If foundry experiences 10 sags at $38K average: $380,000 annual loss blamed on “equipment problems” or “bad luck”.
8. How quickly does power quality monitoring pay for itself?
Comprehensive facility monitoring (₹15-30 lakh/$18K-$36K) plus targeted mitigation (₹20-40 lakh/$24K-$48K) = ₹35-70 lakh total investment. Annual savings: $200K-$354K from reduced voltage sag disruptions, prevented harmonic damage, extended equipment lifespan, and reduced maintenance. Payback calculation: 4-15 months for comprehensive system, with 6-12 months conservative estimate. 15-year NPV: $2.92M-$5.22M, delivering 70-120x ROI over equipment lifecycle.
9. What percentage of our $340K annual power quality losses can be eliminated?
Documented reductions achievable with comprehensive monitoring and mitigation: 50-70% reduction in voltage sag disruptions (from $190K → $57K-$95K), 60-80% reduction in harmonic-induced failures (from $150K → $30K-$60K), recovery toward normal lifespan with 30% degradation improving to 10-15% degradation over 3-5 years. Total annual savings potential: $200K-$354K from $340K baseline losses = 59-104% addressable through systematic approach.
10. Can we start with just monitoring before investing in mitigation equipment?
Yes, monitoring-first approach is recommended. Invest ₹15-30 lakh ($18K-$36K) in comprehensive monitoring to establish irrefutable baseline documenting actual voltage sags, harmonics, and transients. Run 30-90 days quantifying specific losses: “4 sags/month costing $38K each = $152K/month invisible loss + 6.8% THD causing transformer overheating 22°C above rated”. This data-driven business case justifies targeted mitigation (harmonic filters, soft starters, surge protection).
11. Why did Hurricane Fiona cause $2.3M damage to one factory but zero damage to another nearby?
Factory A (grid-dependent, no power quality protection): Grid collapse → violent restoration surges → $2.3M equipment damage including $800K surge damage + $1.5M production loss during two-week recovery. Factory B (23.3 MW microgrid with power quality management): Islanded operation during collapse = zero surge exposure, 100% uptime, zero equipment damage. Asset preservation calculation: $2.3M protected through comprehensive power quality protection during single extreme event.
12. What are the most common early warning signs that power quality is destroying our assets?
Seven documented warning signs: (1) Frequent “unexplained” equipment failures, motors burning out every 12-18 months when rated 15-20 years. (2) Nuisance tripping of protection devices without apparent overload. (3) Transformers running abnormally hot with continuous cooling fan operation. (4) Capacitor banks failing prematurely or protective fuses blowing frequently. (5) Electronic equipment acting erratically, PLCs resetting randomly, VFDs displaying fault codes. (6) Maintenance costs climbing 10-20% annually despite flat production.