Key Takeaways
- Every cubic meter of water generates 10.6 kg (23 lbs) of CO₂ from treatment, pumping, heating, cooling
- US industrial facilities consume 18.2 billion gallons daily, 13% of US electricity goes to water processes
- Over 25% of water entering facilities is wasted through leaks and inefficiency
- Water carbon emissions hide in Scope 3, creating incomplete reporting
- Steel manufacturing can recover 90% of water used, most losses from cooling evaporation
- Pioneer Natural Resources saves $12M annually from 1.5 billion gallons recycled
- Jackson Family Wines achieved 31% water reduction per gallon produced
- Commercial water efficiency payback: 0.32 to 1.53 years
- 1% industrial water reduction = 222 million gallons saved daily nationwide
- Single leaky toilet wastes 4.5 million liters + 46 tons CO₂ annually
Sarah Chen opened the 2025 carbon footprint report on her laptop preparing for next week’s board presentation. As Chief Sustainability Officer for a multi-site steel manufacturer, she had spent six months compiling data across eight facilities. The report looked comprehensive at first glance.
Scope 1 emissions from blast furnaces and boilers: Complete. Scope 2 emissions from purchased electricity: Complete. Scope 3 emissions from supply chain, employee travel, and waste: Tracked and reported. Then she scrolled to the water section. The field was blank with a note reading “data unavailable.”
Her facilities consumed 8 million gallons of water daily. The water bill showed up in operating costs every month. But the carbon emissions from that water never appeared in any sustainability report. The board’s net-zero commitment by 2035 was built on a carbon baseline that excluded water entirely.
Two days before the presentation, the board’s newest member sent a question: “How complete is our carbon accounting? Are we tracking water-related emissions?” Sarah had no answer because her team had never calculated it.
What she didn’t know: Every cubic meter of water carries 10.6 kilograms of CO₂ emissions. Water processes consume 13% of all electricity in the United States. These emissions hide in Scope 3 where most manufacturers never look. Her facilities’ 8 million daily gallons represented 30,283 cubic meters and 321,000 kilograms of CO₂ every single day that existed nowhere in corporate carbon accounting.
Here’s why water represents the largest untracked carbon liability in industrial manufacturing and how closing this Scope 3 gap transforms sustainability reporting from incomplete to credible.
Why Every Cubic Meter of Water Carries 23 Pounds of CO₂
Every cubic meter of water consumed generates 10.6 kilograms or 23 pounds of CO₂ emissions. The breakdown shows 6.9 kilograms from sewage treatment with the remainder from pumping, cleaning, and distribution throughout the water lifecycle. US industrial facilities withdraw 18.2 billion gallons per day from rivers, lakes, and groundwater. An additional 12% of industrial water comes from public water supply systems.
The Math That’s Missing From Your Carbon Report
Consider a manufacturing facility using 1 million gallons daily, which is modest for steel, chemical, or food processing operations. Convert to cubic meters and the volume becomes 3,785 cubic meters. Multiply by 10.6 kilograms of CO₂ per cubic meter and daily emissions reach 40,121 kilograms. Extend that across 365 days and annual carbon emissions from water hit 14.6 million kilograms.
That’s equivalent to the annual emissions of 1,600 homes. None of it appears in standard carbon accounting because water emissions hide in Scope 3 where tracking becomes complicated and most manufacturers stop measuring.
Where Water Carbon Hides in Your Facility
Scope 1 covers direct emissions from sources you own like boilers and furnaces. Scope 2 includes purchased electricity consumption. Scope 3 captures indirect emissions including water treatment, heating, and cooling. Water processes often involve outsourced services or utility providers. Treatment happens off-site at municipal facilities. Heating and cooling energy consumption gets diffused across operations.
The result is carbon cost that remains invisible in standard tracking systems. Water processes consume 13% of all electricity in the United States. Most manufacturers track total electricity consumption but never break out water’s substantial share.
The National Scale Nobody Talks About
Multiply 18.2 billion gallons of daily industrial water use across the entire US manufacturing sector. A 1% reduction in industrial water intake would save 222 million gallons daily. At 10.6 kilograms of CO₂ per cubic meter, that 1% reduction eliminates 8.9 billion kilograms of CO₂ annually.
The stakes extend beyond carbon. 66% of the US population lives in water-scarce regions. Industrial water efficiency reduces pressure on communities competing for limited water resources while simultaneously cutting carbon emissions that most companies never measure.
| Daily Water Volume | Annual CO₂ Emissions (kg) | Equivalent |
| 100,000 gallons | 1,464,380 | 160 homes annually |
| 500,000 gallons | 7,321,900 | 800 homes annually |
| 1,000,000 gallons | 14,644,165 | 1,600 homes annually |
| 5,000,000 gallons | 73,220,825 | 8,000 homes annually |
How 13% of Your Electricity Hides in Water Processes
Water and energy connect in three stages that multiply carbon emissions throughout industrial operations. Treatment requires energy to pump, filter, and purify water before it enters facilities. Usage demands energy to heat water for processes, cool equipment and products, and maintain temperatures. Discharge consumes energy to treat wastewater before returning it to the environment.
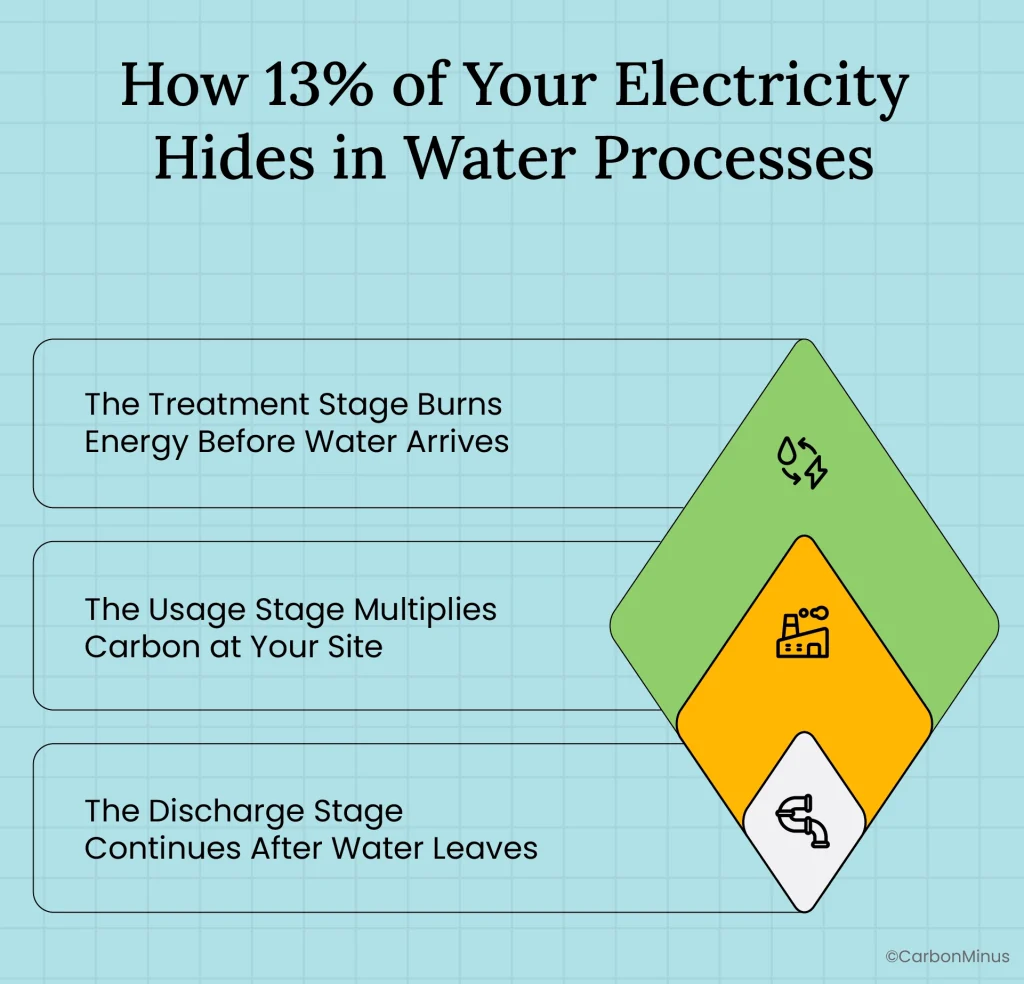
The Treatment Stage Burns Energy Before Water Arrives
Filtration removes particles and contaminants using pumps and pressure systems. Desalination for brackish or seawater sources ranks among the most energy-intensive water treatments available. Chemical dosing and disinfection protect water quality while consuming electricity for pumping and mixing. Every gallon traveling from source to facility burns energy generating carbon emissions.
The Usage Stage Multiplies Carbon at Your Site
Boilers generate steam for industrial processes by heating water to extreme temperatures. Chemical manufacturing requires hot water for reactions that would proceed too slowly at ambient temperatures. Food and beverage operations use hot water for washing, rinsing, and sanitization throughout production.
Cooling represents the flip side with equally high energy demands. Cooling towers reject heat from industrial processes back to the atmosphere. Chillers maintain low temperatures for product quality and equipment protection. Each stage consumes electricity that generates carbon emissions while the water itself carries additional embedded carbon from treatment and distribution.
The Discharge Stage Continues After Water Leaves
Pre-treatment removes contaminants before discharge to municipal systems or waterways. Biological treatment processes use microorganisms requiring aeration and temperature control. Chemical treatment addresses specific pollutants through reactions that need mixing and monitoring. Sludge handling and disposal complete the cycle with additional energy consumption.
Municipal wastewater systems handle much of this treatment as a Scope 3 emission invisible to manufacturing facilities.
When Equipment Fails, the Cascade Accelerates
Degraded chiller efficiency forces equipment to run longer and draw more electricity to achieve the same cooling effect. Scale buildup in boilers acts as insulation requiring additional fuel to generate the same amount of steam. Leaking cooling towers demand increased makeup water that carries the full 10.6 kilogram carbon burden through treatment, distribution, and eventual discharge.
A cooling tower leak wasting 100,000 gallons monthly requires 378.5 cubic meters of makeup water. Multiply by 10.6 kilograms of CO₂ per cubic meter and the leak generates 4,012 kilograms of carbon emissions monthly just from the water replacement. Add pumping energy, treatment processes, and wastewater handling and the total carbon cost multiplies substantially.
Industry Applications That Drive Water Carbon
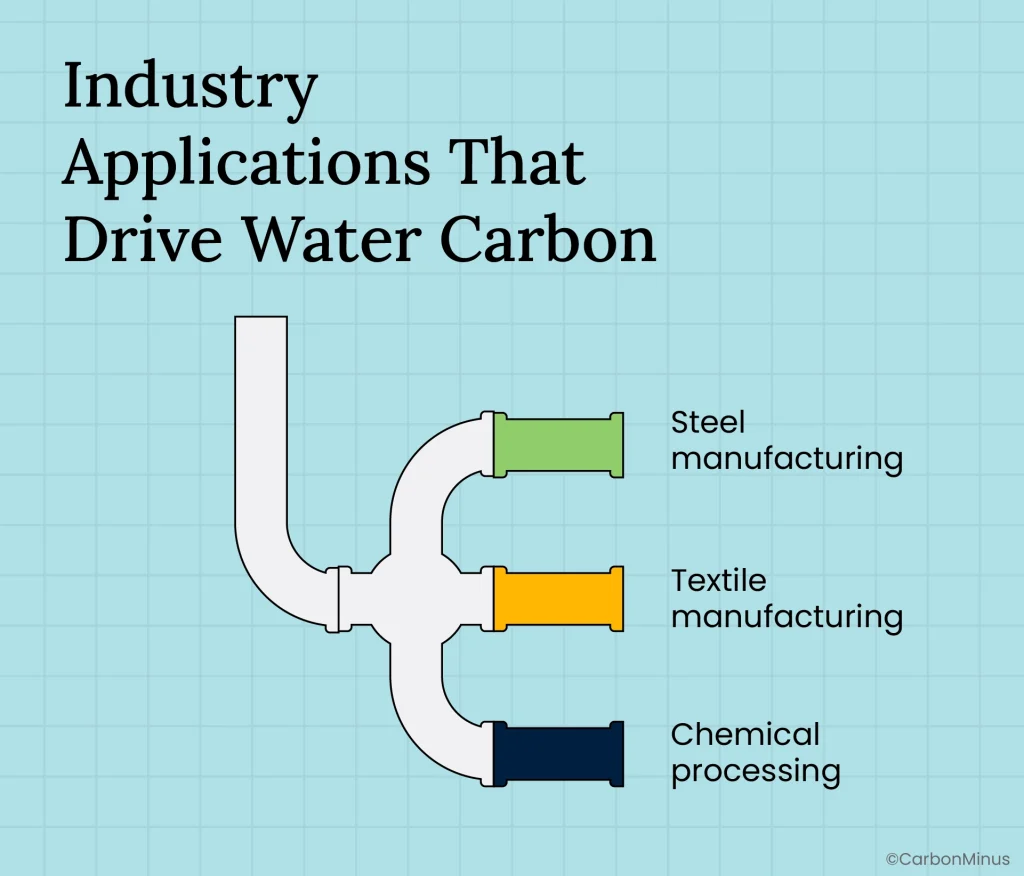
Steel manufacturing uses water for cooling blast furnaces, quenching hot products, and generating steam for power. The good news is steel can recover upwards of 90% of water used with most losses coming from evaporation during cooling processes.
Chemical processing requires high-temperature water heating for reactions, cooling for exothermic processes, and washing for purification steps. Food and beverage operations consume water for washing, rinsing, boiling, and cooling throughout production lines. Jackson Family Wines in California achieved 31% water reduction per gallon of wine produced through comprehensive efficiency programs.
Textile manufacturing demands water heating for dyeing and finishing with extensive wastewater treatment needs. Each industry’s water profile differs but the 10.6 kilogram carbon burden per cubic meter remains constant.
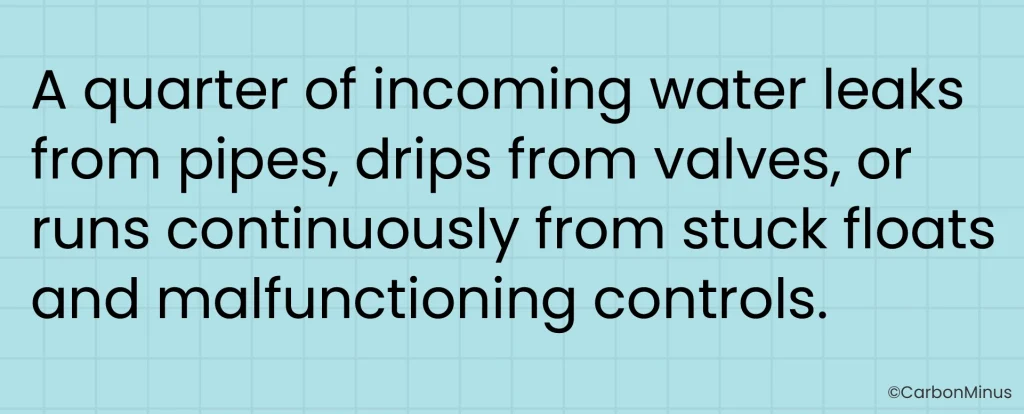
Over One-Quarter of Water Entering Your Facility Goes to Waste
More than 25% of water entering industrial facilities disappears through leaks and inefficiency rather than contributing to production. This water still carries the full 10.6 kilogram CO₂ burden per cubic meter despite never reaching a productive use. The waste represents low-hanging fruit for immediate return on investment since every gallon saved eliminates both water cost and carbon emissions.
The 25% Nobody Measures
Most facilities measure total water consumption from monthly utility bills but never track where water actually goes. The assumption holds that all purchased water flows into production processes. Reality shows different results.
Consider that same 1 million gallon per day facility. Waste at 25% means 250,000 gallons daily or 946 cubic meters serve no productive purpose. Multiply by 10.6 kilograms of CO₂ per cubic meter and preventable waste generates 10,027 kilograms of carbon emissions daily. Extend across a year and the facility produces 3.66 million kilograms of CO₂ from pure waste that could be eliminated with basic monitoring and repairs.
The Leaky Toilet That Cost 46 Tons of CO₂
A single leaking toilet in a commercial facility wasted 4.5 million liters annually. The associated carbon emissions reached 46 tons of CO₂ per year. Repair cost $200 for parts and labor. Annual savings included water cost plus 46 tons of avoided carbon emissions. Payback came in under one month.
Scale that example across an industrial facility with dozens of toilets, urinals, faucets, and process water connections. Small leaks multiply into substantial waste that remains invisible without sub-metering to reveal consumption patterns.
When Cooling Towers Malfunction
A malfunctioning cooling tower in a commercial building generated carbon emissions equivalent to flying 170 people from New York to London. The cause was a stuck float valve that continuously added makeup water regardless of actual need. The problem went undetected for three months. Repair required a $500 valve replacement and monitoring system installation to prevent recurrence.
A Manhattan high-rise discovered one leak that had wasted 27 million liters of water. Carbon emissions from that single leak totaled 340 tons. Real-time monitoring systems caught the anomaly and alerted maintenance within hours. Fix time was four hours after the alert went out. Without monitoring, the leak would have continued indefinitely.
Where Waste Hides in Industrial Operations
Leaks appear in pipe connections, valves, and fittings throughout aging infrastructure. Cooling tower basins and evaporative condenser sumps crack over time allowing continuous water loss. Process equipment seals and gaskets degrade allowing water to escape. Underground piping develops leaks that remain completely invisible without flow monitoring to detect unusual consumption patterns.
Inefficient processes waste water through design rather than equipment failure. Once-through cooling systems discharge water after a single pass instead of recirculating for reuse. Continuous rinse cycles run constantly rather than switching to batch rinse that uses a fraction of the water. Oversized equipment operates at partial load wasting water and energy. Manual controls allow human error while automated optimization adjusts to actual demand.
Operational issues compound equipment and design problems. Equipment runs during non-production hours because nobody turned it off. Cooling towers operate in winter when outdoor temperatures make mechanical cooling unnecessary. Boiler blowdown frequency follows a fixed schedule rather than water quality measurements. Clean-in-place cycles use default water volumes rather than optimizing for actual soil levels.
Why Steel Can Recover 9/10ths of Water and Most Don’t
Steel manufacturing can recover upwards of 90% of water used in production. Less than 10% gets consumed with the rest available for treatment and reuse. Most losses come from evaporation during cooling processes rather than contamination that prevents reuse. The gap between 90% recovery potential and current industry average represents a massive opportunity for water and carbon reduction.
How Steel Uses Water Throughout Production
Blast furnace cooling prevents equipment damage from extreme temperatures during iron production. Continuous casting uses water to solidify molten steel into slabs, blooms, or billets. Hot rolling mills spray water to control temperature and remove scale from steel surfaces. Quenching rapidly cools finished products to achieve desired material properties. Steam generation converts water to power for mill operations.
Each application presents recovery opportunities because water quality requirements vary substantially. Blast furnace cooling tolerates higher dissolved solids than boiler feedwater. Scale removal in rolling mills works effectively with treated process water. Only specific applications like steam generation require high-purity water that demands extensive treatment.
The Path to 90% Recovery
Pre-treatment removes impurities from incoming water before use in production processes. This upfront investment protects equipment and reduces contamination that complicates later reuse. Post-treatment of process water enables recycling for appropriate applications. Not all water needs to return to drinking quality. Matching treatment levels to actual use requirements cuts costs substantially.
Separate contaminated water streams by type rather than mixing everything together. Oil-contaminated water requires different treatment than water with suspended solids or dissolved minerals. Segregation allows targeted treatment that costs less and achieves better results than trying to treat mixed streams to the highest standard needed by any component.
Apply appropriate separation technologies matched to specific contaminants in each stream. Oil-water separators, settling tanks, filtration systems, and membrane technologies each excel at removing particular substances. Right-sizing treatment to actual need avoids over-engineering that wastes capital and operating costs.
The Benefits Beyond Water Savings
Reduced freshwater withdrawal cuts intake costs and can eliminate fees in water-scarce regions. Lower discharge volume decreases wastewater fees and reduces environmental permitting complexity. Raw material recovery from process water captures valuable substances that would otherwise discharge as waste. Cost savings from minimized source water demand often justify investment in recovery systems within two to four years.
The Carbon and Cost Calculation
Consider a steel facility currently using 10 million gallons per day with 50% recovery. Half the water gets reused and half gets withdrawn fresh daily. Improving to 90% recovery means 9 million gallons get reused and only 1 million gallons come in fresh. The reduction is 4 million gallons daily in new water demand.
Convert 4 million gallons to 15,140 cubic meters. Multiply by 10.6 kilograms of CO₂ per cubic meter and daily carbon savings reach 160,484 kilograms. Annual reduction totals 58.6 million kilograms of CO₂ from water reduction alone. Add energy savings from reduced pumping, treatment, and heating of makeup water and total carbon reduction grows substantially larger.
Cost savings include water purchase and treatment expenses, discharge fees avoided, and energy reductions from processing less makeup water. The combination typically delivers payback within two to four years even for comprehensive recovery systems.
When Water Efficiency Delivers $12 Million Annual Savings
Pioneer Natural Resources implemented comprehensive water recycling across oil and gas operations in Texas. Results included 1.5 billion gallons of water saved and $12 million in annual cost savings. Trucking costs dropped substantially as water delivery to remote well sites decreased. Carbon emissions fell from reduced water treatment and transportation.
How Pioneer Built the Business Case
On-site water treatment and recycling eliminated dependence on external water supply in water-scarce West Texas. Closed-loop systems for drilling operations captured and reused water that traditionally got hauled away after single use. Real-time monitoring optimized water use across operations revealing waste that monthly billing never showed. Cross-facility water sharing infrastructure connected sites to balance supply and demand regionally rather than treating each location as isolated.
The investment required millions in infrastructure but annual savings of $12 million delivered rapid payback. Beyond financial returns, Pioneer strengthened its social license to operate in communities competing for limited water resources. Reduced trucking cut road wear and traffic in rural areas. Lower water withdrawal preserved resources for agricultural and municipal use.
Jackson Family Wines Cuts Water Per Gallon by 31%
Jackson Family Wines in California faced water scarcity and sustainability pressure from premium wine consumers. Comprehensive water efficiency programs deployed across vineyards and wineries. Results showed 31% water reduction per gallon of wine produced while maintaining quality and production volume. Enhanced sustainability credentials strengthened market positioning in the premium segment where consumers increasingly value environmental responsibility.
Barrel washing optimization reduced water volume and captured rinse water for reuse in less demanding applications. Cooling system upgrades shifted from once-through to recirculation cutting water demand substantially. Precision agriculture techniques in vineyards applied irrigation only where and when needed based on soil moisture monitoring. Wastewater treatment enabled reuse for landscape irrigation closing the loop.
The $500 Million Texas Opportunity
Analysis of the entire Texas oil and gas sector revealed $500 million in potential annual savings from water recycling. Billions of gallons would be preserved for competing uses in a water-scarce state. Carbon emissions avoidance would total in the tens of millions of kilograms annually. Despite proven returns, current adoption remains low across the sector.
Barriers include upfront capital requirements, technical complexity, and regulatory uncertainty around water reuse. Early adopters like Pioneer gain competitive advantage through lower operating costs and stronger community relationships. As water scarcity intensifies and carbon costs rise, the business case for efficiency strengthens while barriers to adoption fall.
Commercial Building Paybacks Under Two Years
Studies of commercial building water efficiency retrofits focused on toilets, urinals, faucets, and cooling towers. Documented payback periods ranged from 0.32 to 1.53 years for toilet retrofits. Cooling tower optimization typically paid back in under two years. Faucet aerators delivered payback in under six months.
Industrial facilities see similar or better paybacks due to higher water volumes that magnify savings. A 1% reduction across all US industrial water use saves 222 million gallons daily. At 10.6 kilograms of CO₂ per cubic meter, that 1% translates to 8.9 billion kilograms of annual carbon reduction.
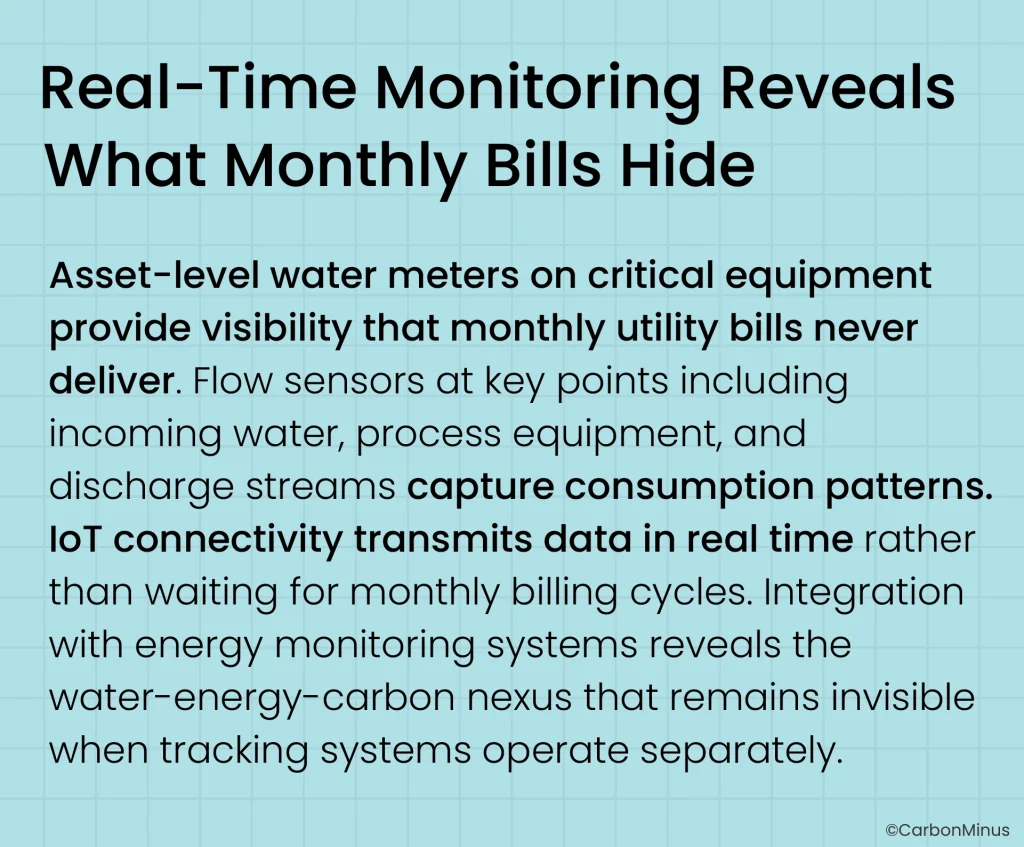
What Gets Measured at the Asset Level
Cooling tower makeup water and blowdown rates indicate efficiency and reveal leaks that waste thousands of gallons daily. Boiler feedwater and blowdown volumes show whether blowdown happens based on water quality measurements or arbitrary schedules that waste water. Process equipment water consumption patterns identify inefficient operating modes and opportunities for optimization. Chiller and heat exchanger flow rates reveal fouling that degrades performance and increases water use. Wastewater discharge volumes help balance the water budget identifying the 25% that goes to waste.
Granularity reveals waste completely invisible in utility bills that show only total monthly consumption. The 25% facility waste only becomes visible with sub-metering that tracks where water actually goes. Monthly bills cannot distinguish between production water and leak water. Real-time asset monitoring makes the distinction immediately clear.
How AI Catches the Leaks Humans Miss
Pattern recognition algorithms identify anomalies in water consumption that indicate problems. Baseline establishment documents normal operating ranges for each piece of monitored equipment. Automated alerts trigger when consumption exceeds expected levels based on production schedules and historical patterns.
Underground pipe leaks reveal themselves through continuous flow during non-production hours when no equipment should be drawing water. Valve leaks show gradual flow increases over time as seals degrade. Cooling tower problems appear as makeup water spikes when float valves stick or leaks develop. Equipment malfunction produces sudden consumption changes that deviate from established patterns.
The Manhattan high-rise case demonstrated detection capabilities when monitoring systems caught a 27 million liter leak. Early alert prevented the leak from becoming chronic and saved 340 tons of CO₂ emissions. Without real-time monitoring, the leak would have continued indefinitely showing up only as higher monthly water bills that nobody investigated.
Process Optimization Through Data Analysis
AI analyzes relationships between water consumption, energy use, and production output. The system identifies operating modes that consume more water than necessary for actual production requirements. Recommendations flow to operators and maintenance teams suggesting specific adjustments to reduce water waste.
Cooling tower cycles of concentration can be maximized before blowdown by monitoring water quality continuously rather than following fixed schedules. Boiler blowdown timing and volume optimize based on conductivity measurements instead of time intervals. Clean-in-place cycle duration and water volume adjust to actual soil levels detected by sensors rather than running default programs. Heat exchanger fouling detection through flow and temperature monitoring indicates when efficiency losses from scaling require attention.
Integration with production scheduling enables water-aware planning that minimizes consumption during peak water cost periods or drought conditions. Predictive maintenance prevents equipment degradation that increases water waste as seals fail and efficiency drops.
Why Incomplete Scope 3 Undermines Your Net-Zero Credibility
Regulators and investors increasingly scrutinize Scope 3 completeness in corporate carbon reporting. Water emissions represent a significant gap in most sustainability reports. The 13% of facility electricity consumed by water processes typically goes untracked. Incomplete carbon baselines make net-zero commitments questionable because reduction pathways built on partial data miss substantial emission sources.
The Compliance Frameworks Demanding Complete Scope 3
ISO 14064 establishes principles for greenhouse gas accounting and verification including Scope 3 indirect emissions. ISO 50001 requires energy management systems that track energy consumption by source including water-related energy. The Carbon Border Adjustment Mechanism levies fees on imports based on embedded carbon including water processing. SEC climate disclosure rules under development will require comprehensive Scope 3 reporting. GRI standards for sustainability reporting expect complete accounting of material emissions sources.
Companies with incomplete Scope 3 tracking face credibility risk as reporting standards tighten. The gap between reported emissions and actual emissions grows when water carbon goes unmeasured. Investors and regulators recognize that net-zero commitments without complete baselines amount to aspirations rather than science-based targets.
Water Scarcity Adds Social Pressure
66% of the US population lives in regions experiencing water scarcity at some point during the year. Industrial water use increasingly draws scrutiny from communities competing for limited resources. Social license to operate depends on demonstrated water stewardship that goes beyond compliance to show genuine efficiency efforts.
US industrial facilities withdraw 18.2 billion gallons daily. Efficiency improvements reduce conflict with municipal and agricultural users who share the same water sources. Local communities expect responsible water use from industrial neighbors. Investors assess water risk in portfolio companies particularly for facilities in water-scarce regions. Customers prefer suppliers demonstrating strong water stewardship credentials. Regulators may impose restrictions on water-intensive industries in drought-prone areas.
Competitive Advantage Through Complete Reporting
Early adopters of comprehensive Scope 3 tracking including water emissions gain market advantages over competitors with incomplete reporting. Enhanced ESG scores improve access to capital as investors prioritize companies with complete carbon accounting. Premium customers increasingly prefer suppliers who can document their full carbon footprint including indirect emissions. Regulatory compliance becomes easier with established tracking systems rather than scrambling when new requirements take effect.
Market differentiation messages include complete carbon footprint tracking including water emissions, quantified Scope 3 water carbon reductions with annual progress reporting, third-party verified water-carbon accounting providing credibility, and industry-leading transparency in sustainability reporting that builds trust with stakeholders.
Competitors with incomplete Scope 3 reporting face credibility gaps when customers and investors compare carbon accounting quality. The 2026 reporting season determines who leads with complete accounting and who follows with partial data.
From Water Blind Spots to Complete Carbon Visibility in 120 Days
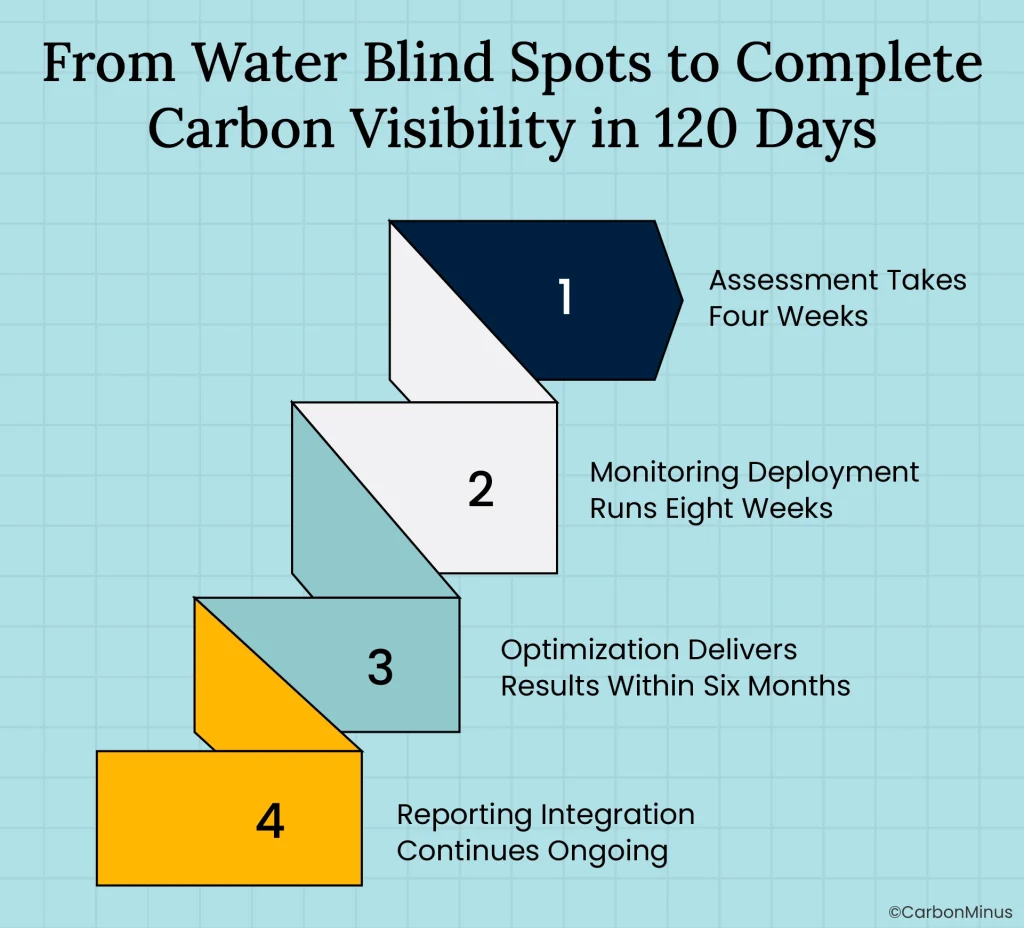
Phase One Assessment Takes Four Weeks
Audit current water consumption by source identifying municipal water, groundwater wells, and surface water intake. Map water flows through the facility from incoming treatment through process use to final discharge. Identify major consumption points including cooling systems, heating systems, process equipment, and sanitation facilities. Calculate current carbon footprint using 10.6 kilograms of CO₂ per cubic meter.
Assessment deliverables include total water consumption baseline showing daily, monthly, and annual volumes. Carbon emissions from water represent currently untracked Scope 3 showing the reporting gap. High-consumption equipment identification reveals where monitoring delivers maximum value. Leak and waste opportunity quantification targets the 25% typically wasted. ROI modeling projects payback periods for efficiency improvements.
Phase Two Monitoring Deployment Runs Eight Weeks
Install smart meters on critical water-consuming equipment starting with cooling towers, boilers, and major process lines. Deploy IoT sensors for real-time data collection with wireless connectivity to avoid infrastructure costs. Integrate monitoring systems with existing energy management platforms to reveal water-energy connections. Configure dashboards for operations teams showing water use patterns and sustainability teams tracking carbon emissions. Establish baseline operating ranges that enable leak detection algorithms to identify anomalies.
Monitoring coverage should include cooling tower makeup water, blowdown, and circulation volumes. Boiler systems require feedwater metering, blowdown measurement, and steam production tracking. Process equipment needs individual metering for washing, rinsing, and cooling applications. Chillers and heat exchangers benefit from flow monitoring that detects fouling. Compressed air system condensate drains often waste substantial water that goes completely unmeasured.
Phase Three Optimization Delivers Results Within Six Months
AI algorithms identify inefficiencies and waste across monitored systems. Implementation begins with quick wins including leak repairs and operational adjustments that cost little but save substantially. Process optimization recommendations deploy after validation showing water reduction without production impacts. Renewable energy integration can power water-related electricity consumption cutting Scope 2 emissions associated with water processing.
Expected results by week 24 include 10 to 15% water consumption reduction achieved by eliminating the 25% waste factor. Proportional carbon emissions reduction follows at 10.6 kilograms per cubic meter saved. Complete Scope 3 water emissions tracking closes the reporting gap. ROI validation confirms payback projections supporting full-scale deployment across additional facilities.
Phase Four Reporting Integration Continues Ongoing
Automated Scope 3 water emissions calculations eliminate manual data collection and spreadsheet tracking. Integration with carbon accounting platforms ensures water emissions flow into comprehensive reporting. Dashboards provide real-time carbon footprint visibility showing how daily operations affect emissions. Quarterly sustainability reporting automation reduces the burden of compliance and investor disclosure. Third-party verification documentation supports audited carbon reports with defensible data.
Complete Your Carbon Picture in 2026
Two paths diverge for manufacturers preparing 2026 sustainability reports. The first path continues with incomplete Scope 3 where water emissions remain unmeasured. The 13% of facility electricity consumed by water processes stays invisible. The 10.6 kilograms of CO₂ per cubic meter never appears in carbon accounting, and the 25% water waste goes unidentified and uncorrected. This kind of incomplete carbon reporting undermines net-zero credibility, especially as Carbon Credits 2025 brings greater scrutiny from investors and regulators questioning why material emission sources are missing from the baseline.
The Cost of Continuing Without Water Tracking
Competitors with complete Scope 3 including water gain investor and customer preference. ESG ratings penalize incomplete accounting reducing access to sustainability-focused capital. Net-zero commitments built on partial baselines face credibility challenges when stakeholders recognize the gaps. Regulatory compliance becomes harder as reporting standards tighten and water carbon becomes mandatory disclosure. The 25% facility water waste continues generating unnecessary costs and carbon emissions.
The Value of Complete Visibility
The second path deploys water-carbon tracking to close the Scope 3 gap in 2026. Complete visibility includes the 13% of electricity that water processes consume. Carbon accounting captures all 10.6 kilograms of CO₂ per cubic meter that water generates. The 25% waste factor gets identified and eliminated delivering immediate ROI. Under two-year payback comes from proven case studies including Pioneer’s $12 million annual savings and Jackson’s 31% reduction.
Enhanced ESG credibility stems from complete rather than partial carbon accounting. Competitive advantage emerges in sustainability-conscious markets where customers value comprehensive reporting. Steel facilities can target the 90% water recovery potential that most competitors ignore. Regulatory compliance strengthens with established tracking systems ready for tightening standards.
The 2026 reporting deadline determines whether carbon accounting moves from incomplete to comprehensive. Budget decisions happening now in December 2025 establish whether water carbon tracking deploys before next year’s sustainability reports or whether gaps persist while competitors close theirs.
FAQs
Water requires energy for pumping, treatment, heating, cooling, and wastewater processing. These activities consume electricity and fuel generating carbon emissions. The 10.6 kg includes 6.9 kg from sewage treatment plus energy for delivery, cleaning, and distribution throughout the water lifecycle.
Scope 2 covers purchased electricity at the meter. Water-related energy consumption happens at municipal treatment facilities, during heating and cooling in your processes, and in wastewater treatment. These are indirect emissions falling under Scope 3. Most facilities track electricity bills but not water’s embedded energy.
Commercial building water efficiency shows 0.32 to 1.53 year paybacks. Pioneer Natural Resources saves $12 million annually from water recycling. Jackson Family Wines achieved 31% reduction with under two-year payback typical. Industrial facilities see similar or better returns due to higher volumes.
Steel uses water primarily for cooling blast furnaces, rolling mills, and quenching. Pre-treatment and post-treatment systems enable reuse. Most losses come from evaporation during cooling which can be minimized with closed-loop systems and cooling tower optimization. Less than 10% needs to be consumed.
Install smart meters on major water-consuming equipment including cooling towers, boilers, and process lines. Real-time monitoring reveals consumption patterns invisible in monthly utility bills. AI-driven leak detection identifies anomalies like the Manhattan high-rise leak that wasted 27 million liters and generated 340 tons CO₂.