Key Takeaways
- $50 billion annual US manufacturing losses from equipment failures, 800 hours average downtime per facility
- 143% first-year ROI documented, 10x over three years average
- 95% positive ROI adoption rate, 27% achieve 12-month payback
- 73% positive ROI within 12 to 18 months
- 70 to 75% fewer equipment breakdowns, 35 to 45% downtime reduction
- 25 to 30% maintenance cost reduction, emergency repairs at three to five times cost avoided
- 8 to 12% energy savings, failing equipment wastes 20 to 50% more energy
- Three to six months baseline establishment required, 60% false positives if rushed
- Two to four weeks advance failure warning enables planned maintenance
- Retrofits to 1990s equipment, no replacement needed
Jennifer Martinez sat in the December budget review meeting with her CFO reviewing the 2026 maintenance line item. The number looked familiar because it was identical to 2025: $3.2 million for reactive maintenance across eight manufacturing facilities.
Her CFO pushed the spreadsheet back across the table. “We’re 15% above industry benchmark on operating costs. What are we doing differently in 2026?”
Jennifer had no answer because the plan was to do exactly what they did in 2025. React to equipment failures when they happened. Schedule emergency repairs at three to five times normal cost. Watch production lines go dark while competitors somehow maintained 99.5% uptime guarantees.
Three weeks earlier, her largest customer had reduced order volume by 30% after the third supply chain disruption of the year. Each disruption traced back to unexpected equipment failures. The customer’s procurement director was direct: “We’re shifting volume to suppliers who can promise reliability.”
The budget meeting was December 2025. Approvals would lock in January 2026. Jennifer had 30 days to decide whether predictive maintenance belonged in the 2026 budget or whether that was something to consider in 2027 or 2028.
What she didn’t know: 73% of predictive maintenance implementations achieve positive ROI within 12 to 18 months. The documented first-year return is 143%. The three to five year payback myth keeping predictive maintenance out of budgets has been disproven by facilities across steel, automotive, chemical, and cement manufacturing.
Here’s what actually happens when manufacturers deploy predictive maintenance in 2026 and why the budget decision happening right now determines competitive position through 2027 and 2028.
Why 800 Hours of Downtime Costs US Manufacturers $50 Billion Annually
US manufacturing facilities lose $50 billion every year to equipment failures. The average plant experiences 800 hours of unplanned downtime annually. In automotive manufacturing, every hour of downtime costs $2 to $2.3 million. The median across all manufacturing sits at $125,000 per hour.
The $100 Million Question Every Plant Manager Ignores
A facility running 800 hours of downtime at the median rate bleeds $100 million annually. Multiply that across thousands of US manufacturing plants and you reach $50 billion in destroyed value from equipment that could have been maintained before it failed.
The visibility problem explains why this continues. 40% of manufacturers have zero real-time equipment monitoring. 56% only identify problems after they occur. Equipment typically degrades over six to eight weeks before catastrophic failure. Current reactive approaches only notice the problem when production stops.
What Six Weeks of Invisible Failure Looks Like
Consider a bearing degrading over 45 days. Week one shows slight vibration increases invisible without sensors. Week three displays thermal signatures detectable with monitoring. Week six reveals acoustic patterns indicating imminent failure. Week seven delivers catastrophic breakdown during peak production shift, followed by emergency repairs at five times normal cost.
The Hidden Cost Cascade Nobody Calculates
The cost cascade extends far beyond the immediate repair bill. Emergency repairs carry a three to five times multiplier over planned maintenance. A $2,500 planned bearing replacement becomes a $12,500 emergency when it includes overtime at 1.5 to 2 times base rate, contractors at 3 to 4 times standard pricing, and expedited parts shipped via air freight.
Failing idle equipment also wastes 20 to 50% more energy than properly maintained assets. A motor with degraded bearings runs 35% hotter and draws 35% more power. If that degradation goes undetected for six weeks, the facility burns $8,400 in excess energy per motor before the failure even occurs.
Quality degradation happens before complete failure. Parts produced in the weeks leading up to equipment breakdown show higher defect rates. Supply chains experience domino effects when critical equipment fails unexpectedly. Equipment lifespan drops 30% under reactive maintenance compared to predictive approaches.
| Maintenance Approach | Detection Window | Cost Multiplier | Annual Failure Events |
| Reactive (after failure) | 0 hours advance warning | 3-5x planned cost | 15-20 events |
| Preventive (time-based) | Scheduled regardless of condition | 1.2-1.5x baseline | 8-12 events |
| Predictive (condition-based) | 2-4 weeks advance warning | 1x planned cost | 2-4 events |
95% Positive ROI Documented: The Competitive Shift Happening Now
95% of facilities that deploy predictive maintenance report positive ROI. 27% achieve full payback within 12 months. 73% reach positive ROI within 12 to 18 months. The predictive maintenance market is accelerating toward $47.8 billion by 2029 at a compound annual growth rate between 21.9% and 33.5% depending on which forecast you read.
Why 2026 Is Different From 2023
The United States leads North America adoption. The market saw an 18.7% adoption increase in 2022 alone. Early adopters are building 10 to 15% efficiency advantages over competitors still operating reactively.
The competitive gap shows up in contract negotiations. Customers increasingly require demonstrated reliability in supplier agreements. A 99.5% uptime guarantee requires predictive capability because reactive maintenance cannot promise uptime, only react to failures after they destroy production schedules.
How Competitors Win Contracts You Can’t Match
Facilities operating reactively in 2026 will lose contracts to competitors who can document reliability through condition-based monitoring. The customer conversation shifts from “what’s your price” to “can you guarantee delivery” when supply chains tighten. Predictive maintenance transforms reliability from hope into data.
The Technology Finally Works (Unlike 2020)
The technology maturity moment has arrived after five years of field validation. AI pattern recognition now delivers 40% better detection accuracy compared to manual monitoring. False alarm rates dropped 30% as algorithms improved. IoT sensor costs fell 80% since 2018. Cloud infrastructure eliminated the need for on-premise servers.
The difference between 2020 and 2026 is measurable. Five years ago predictive maintenance was experimental with high false positive rates that destroyed operator trust. Three years ago the technology was proven but adoption remained limited. Today 95% positive ROI is documented across steel, automotive, chemical, and cement facilities with multiple case studies showing 10x returns over three years.
The baseline establishment process has been refined to three to six months with clear results timelines. ROI models are proven. Integration with existing CMMS and ERP systems is mature. The question is no longer whether predictive maintenance works but whether your facility deploys it in 2026 or watches competitors maintain their lead through 2027 and 2028.
143% First-Year ROI: Why CFOs Approve $450K Investments in 30 Minutes
The documented first-year ROI for predictive maintenance is 143%. The average return over three years is 10x the initial investment. Payback periods for high-downtime equipment run 6-9 months. The US Department of Energy documents these 10x ROI increases across industrial facilities.
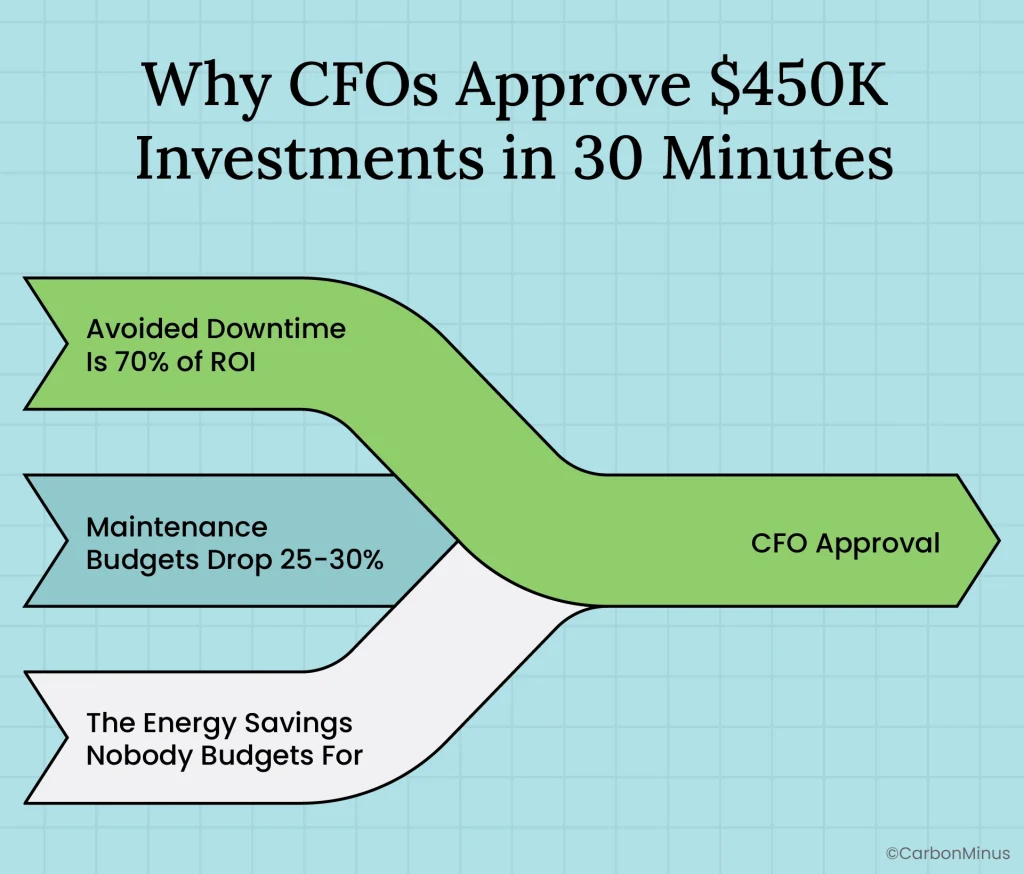
Stream One: Avoided Downtime Is 70% of ROI
Predictive maintenance delivers 70 to 75% fewer equipment breakdowns. Unplanned downtime drops 35 to 45%. At the median manufacturing rate of $125,000 per hour, preventing 10 failures saves $1.25 million.
The automotive components example demonstrates the scale. Reducing breakdowns from 20 per month to five per month prevented 180 annual failure events. Each event averaged 1.87 hours of downtime at $2.3 million per hour. Total preserved production value reached $773 million from predictive intervention.
Stream Two: Maintenance Budgets Drop 25-30%
Annual maintenance costs drop 25 to 30% with predictive approaches. The savings reach up to 40% compared to reactive maintenance. Emergency repairs disappear and their three to five times cost premium vanishes.
Spare parts inventory requirements fall 15 to 25% because condition-based monitoring enables just-in-time ordering instead of stockpiling parts for unpredictable failures. Overtime and contractor costs decline as maintenance shifts from emergency response to planned scheduling.
Stream Three: The Energy Savings Nobody Budgets For
Total energy consumption decreases 8 to 12% with predictive maintenance. Some deployments document 18% energy savings. Failing equipment consumes 20 to 50% more energy than properly maintained assets.
The cement plant case isolated energy waste from three air compressors at 163,320 kilowatt-hours annually. The $16,332 savings came from just three monitored assets. Scaling that across 40 to 50 critical pieces of equipment in a facility multiplies the energy ROI stream significantly.
How To Present This To Your CFO
Budget request: $450,000 covering sensors, software platform, integration, installation, and training for 40 critical assets.
Year one conservative savings projection: $640,000 broken into $480,000 from 40% downtime reduction (800 hours at $125,000 per hour), $120,000 from 25% maintenance cost reduction, and $40,000 from 8% energy consumption improvement.
Payback period: 8.4 months. Year three cumulative savings: $2.1 million. Three-year ROI: 4.7 times investment using conservative projections compared to documented 10x returns.
Risk mitigation: 95% adoption rate shows positive ROI. Phased deployment limits downside exposure. Six-month pilot validates ROI before full deployment commitment.
Why ‘Instant ROI’ Promises Fail: The Learning Period Nobody Mentions
Predictive maintenance requires a three to six month baseline establishment period. AI must learn equipment’s normal operating patterns before it can detect anomalies. Rushing this baseline creates a 60% false positive rate. False alarms destroy operator trust and kill adoption before the system proves value.
Think of Baseline Like Learning a Heartbeat
Think of baseline establishment like learning a person’s heartbeat. A doctor cannot diagnose an irregular heartbeat without first knowing what regular looks like for that specific patient. Equipment operates the same way. Normal vibration patterns vary across load ranges. Thermal signatures change under different operating conditions. Power consumption profiles shift with production schedules.
AI documents these patterns during the baseline period. High-speed motors need four to six weeks minimum. Pumps with variable loads require eight to twelve weeks. Compressors take six to ten weeks. Complex production lines may need three to six months for complete baseline establishment.
What Happens When You Rush It
Vendors who promise immediate results either skip baseline establishment or use generic patterns that generate false alarms. A facility that rushed deployment reported 60% false positive rates in the first three months. Operators responded to dozens of alarms for equipment that was operating normally. After six weeks, operators began ignoring all alerts including legitimate warnings. The system failed because the baseline was inadequate.
Month Four: Your First Prevented Failure
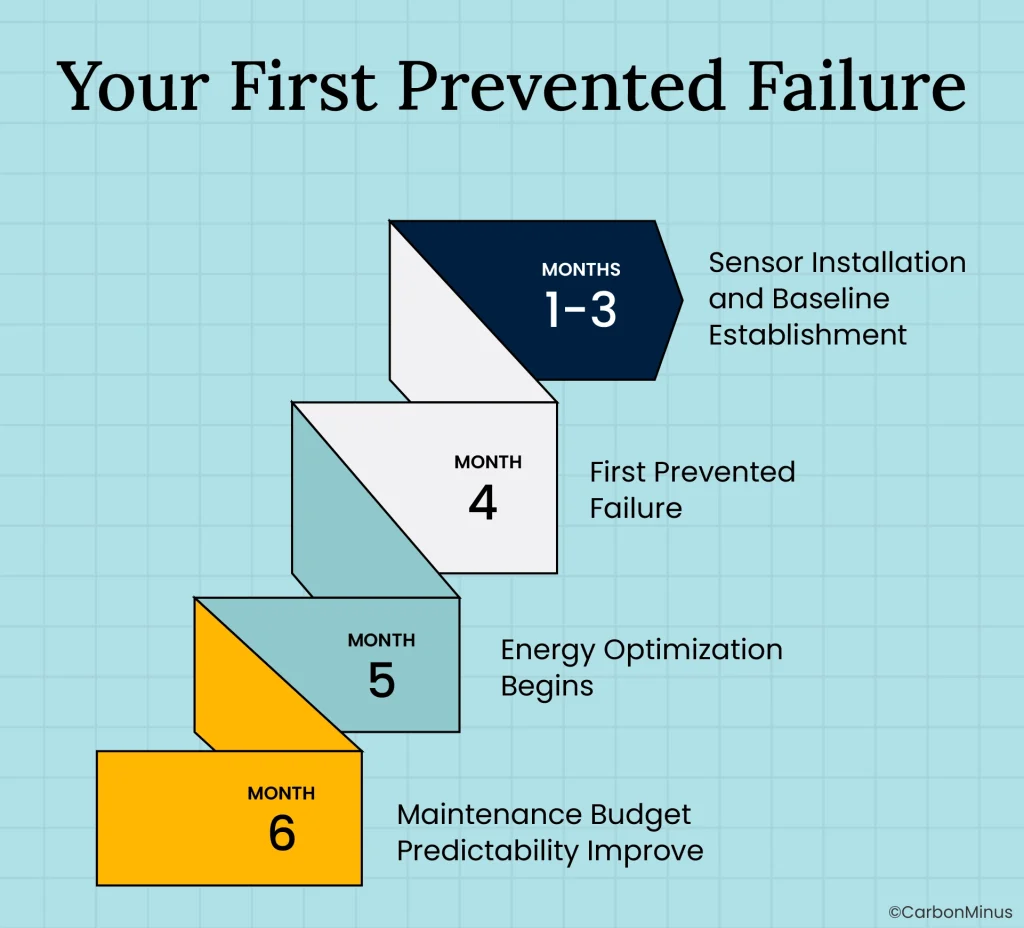
Months 1-3: Sensor Installation and Baseline Establishment
IoT sensors deploy on critical assets. Data collection begins immediately. Normal operating patterns get documented across varying loads and conditions. The system has no predictive capability yet because it’s learning what normal means for each piece of equipment.
Month 4: First Prevented Failure
AI detects the first anomaly that falls outside established baseline patterns. The system provides two to four weeks of advance warning before projected failure. Maintenance schedules a planned repair during the next scheduled downtime window. The emergency repair with its three to five times cost premium never happens.
Month 5: Energy Optimization Begins
The system identifies equipment operating inefficiently compared to baseline patterns. Energy waste gets quantified by asset. Optimization recommendations flow to maintenance and operations teams.
Month 6: Maintenance Budget Predictability Improves
Failure prediction confidence increases as the AI processes more operating cycles. Maintenance transitions from reactive firefighting to planned scheduling. Spare parts ordering optimizes based on predicted needs instead of emergency purchases.
Start Small, Scale Fast
Start with a pilot program covering five to ten critical assets. A 90-day pilot deployment is realistic for validating ROI before full facility rollout. The pilot builds internal expertise and demonstrates value to skeptical operators and managers.
Phased deployment after pilot validation works best. Phase one covers critical downtime-prone equipment. Phase two adds high energy consumption assets. Phase three expands to quality-critical production lines. Phase four achieves facility-wide integration.
Common mistakes include skipping baseline establishment and facing 60% false positives, deploying facility-wide before pilot validation, ignoring CMMS integration requirements, and providing inadequate operator training.
Retrofitting 1990s Equipment Without Full Replacement
Predictive maintenance retrofits to equipment manufactured in the 1990s. Complete equipment replacement is not required. External sensors mount to existing assets without modification. Wireless data transmission eliminates the need for running new cables throughout facilities. Cloud-based processing removes the requirement for on-premise servers.
Five Sensor Types That Mount Externally
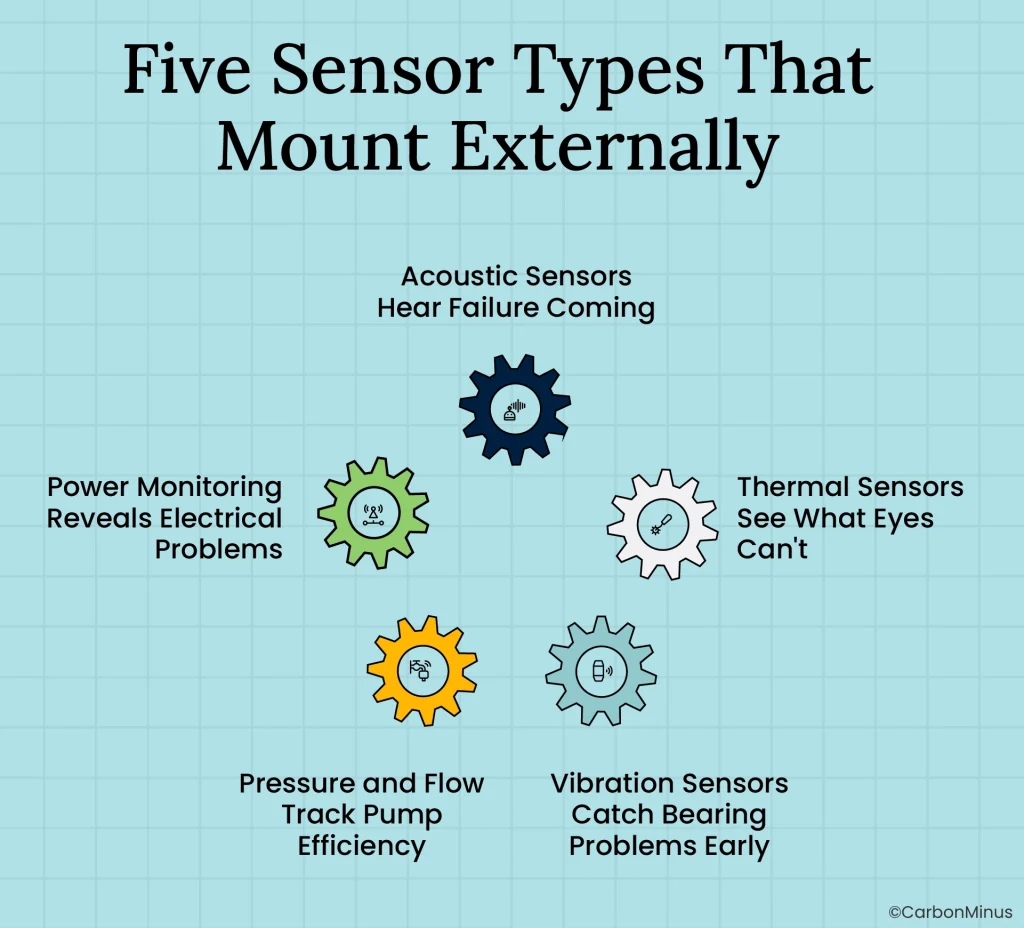
Vibration Sensors Catch Bearing Problems Early
Accelerometers detect bearing wear, shaft misalignment, and rotor imbalance. These sensors provide two to three weeks of advance warning on typical bearing failures. Wireless accelerometers mount externally on motor housings without requiring equipment disassembly.
Thermal Sensors See What Eyes Can’t
Infrared temperature monitoring identifies overheating components and insulation degradation. Thermal issues typically present one to two weeks before failure. Temperature patterns often reveal problems invisible to vibration analysis alone.
Acoustic Sensors Hear Failure Coming
Ultrasonic frequency monitoring detects air leaks, cavitation in pumps, and bearing defects at early stages. Acoustic signatures change before vibration or thermal patterns become obvious.
Power Monitoring Reveals Electrical Problems
Current signature analysis reveals motor problems through electrical consumption patterns. Power quality issues show up as voltage or current anomalies. Energy waste quantification happens automatically as power monitoring tracks consumption by asset.
Pressure and Flow Track Pump Efficiency
Pump efficiency degradation appears in pressure and flow measurements before mechanical failure occurs. Hydraulic system leaks reveal themselves through pressure drops.
AI Gets 40% Better Detection Than Humans
Algorithms compare current operating data against established baseline patterns. Detection accuracy improves 40% compared to manual monitoring approaches. False alarm rates drop 30% as machine learning models refine predictions.
The system provides two to four weeks of advance warning before most failures. Work orders generate automatically and integrate with existing CMMS platforms. Machine learning models categorize anomaly detection, remaining useful life prediction, failure mode classification, and energy efficiency optimization.
A 1995 CNC Machine That Paid Back in 8 Months
A 1995 CNC machine received vibration and thermal sensors as a retrofit. The total sensor and gateway cost was $3,500. Eight months after deployment, the system detected bearing degradation and prevented a failure that would have required a $28,000 emergency repair. The equipment lifespan extended by over five years beyond the original expected retirement date.
External sensor mounting works on equipment decades old. Wireless transmission eliminates the wiring infrastructure that would make retrofits prohibitively expensive. Cloud processing means no server room upgrades or IT infrastructure investments.
From Budget Approval to First Prevented Failure in 120 Days
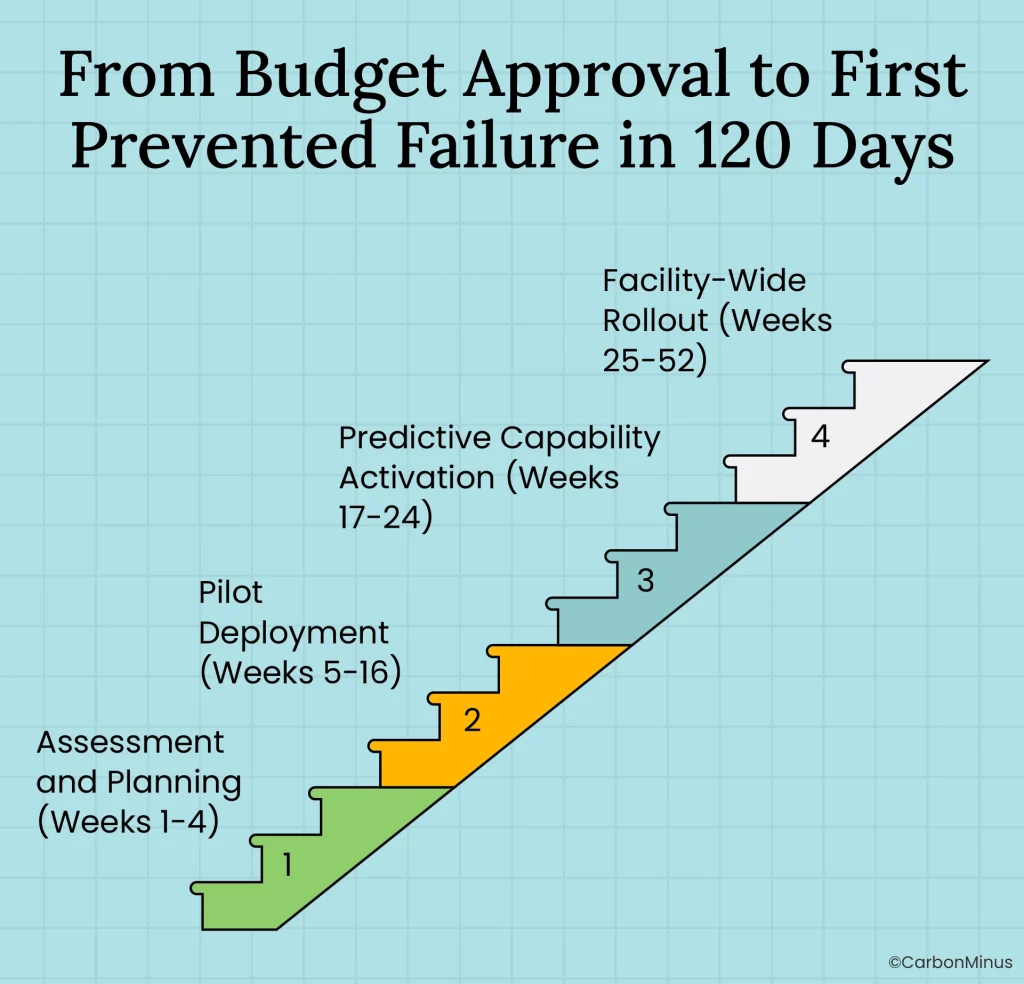
Phase One: Assessment and Planning (Weeks 1-4)
Audit the complete equipment inventory. Identify assets responsible for the majority of unplanned downtime. Calculate current downtime costs using actual hours and your facility’s cost per hour. Select five to ten pilot equipment units. Define success metrics that will validate ROI. Secure budget approval for the typical $450,000 investment.
Phase Two: Pilot Deployment (Weeks 5-16)
Install IoT sensors on pilot equipment. Set up gateway devices and network connectivity. Integrate with existing CMMS platforms. Begin baseline establishment for the 12-week learning period. Train operators and maintenance teams on the new system.
Phase Three: Predictive Capability Activation (Weeks 17-24)
AI models complete training on baseline data collected during phase two. First anomaly detection typically occurs during this phase. Automated maintenance work orders begin flowing from the system. First prevented failure usually happens between weeks 16 and 20. ROI validation confirms projected savings match actual results.
Phase Four: Facility-Wide Rollout (Weeks 25-52)
Deploy sensors to all critical equipment identified in phase one assessment. Integrate energy optimization capabilities across facility operations. Predictive maintenance becomes the standard approach replacing reactive methods. Connect to ERP and ESG reporting systems for comprehensive data visibility.
Where the $450,000 Actually Goes
IoT sensors and wireless gateways: $120,000 covering 40 assets at $3,000 average per asset. Software platform subscription for three years: $150,000. Integration with existing CMMS and ERP systems: $80,000. Installation and commissioning services: $60,000. Training and change management: $40,000.
The 120-day timeline from budget approval to first prevented failure assumes starting in January 2026. Budget approval in January leads to assessment completion in February. Pilot deployment runs March through May. Predictive capability activates in June with first prevented failure typically in April or May as baseline establishment completes.
How 8-12% Energy Savings Automates Scope 2 Compliance
Failing equipment consumes 20 to 50% more energy than properly maintained assets. Total facility energy consumption drops 8 to 12% with predictive maintenance deployment. Some implementations document 18% energy savings.
That Degraded Bearing Is Costing You $8,400
A motor with degraded bearings runs 35% hotter than baseline and draws 35% more power. If predictive maintenance detects the degradation four weeks before catastrophic failure, the early intervention prevents four weeks of excess energy consumption. Multiply that across dozens of motors and the energy savings become substantial.
Three Air Compressors Saved $16,332 Annually
The cement plant case isolated three air compressors. Predictive monitoring identified inefficient operation patterns consuming 163,320 kilowatt-hours of annual waste. The $16,332 savings came from only three pieces of equipment in a facility with hundreds of assets.
Your ESG Report Writes Itself
Scope 2 emissions automatically decrease when energy consumption drops 8 to 12%. Predictive maintenance data feeds directly into ISO 50001, ISO 14064, and CBAM compliance reporting. Equipment efficiency tracking becomes automated rather than manual.
75% of investors view companies with strong ESG performance as better investment opportunities. Companies with strong ESG credentials show 50% better long-term returns compared to peers. The energy reduction from predictive maintenance serves both operational efficiency and sustainability reporting requirements.
Reporting automation includes real-time energy consumption tracked by individual asset, emissions reduction monitoring tied to specific equipment improvements, maintenance efficiency KPIs for sustainability reports, and uptime reliability metrics demonstrating operational excellence.
Five Stakeholders, One Investment
Operations teams focus on 35 to 45% downtime reduction. CFOs care about 10x ROI over three years. Sustainability teams need 8 to 12% emissions reduction automated into reporting. Sales teams want uptime SLAs that enable premium contract wins. Supply chain leaders require reliability improvements for delivery performance.
A single $450,000 investment serves all five stakeholder groups. That makes budget approval easier because multiple departments see value from the same capital allocation.
Lead in 2026 or Follow in 2028
Path One: The Reactive Route
Two paths diverge in December 2025 budget planning. The first path continues reactive maintenance with the same $3.2 million budget from 2025. By Q2 2026, a competitor wins a major contract with a 99.5% uptime SLA guarantee. By Q4 2026, the third supply chain disruption loses a significant customer. By 2027, the board questions why operating costs remain 15% above industry benchmarks. By 2028, the facility plays catch-up while competitors maintain their efficiency lead.
Path Two: The Predictive Advantage
The second path approves $450,000 for predictive maintenance in the 2026 budget. By Q2 2026, the pilot shows first prevented failures. By Q3 2026, the facility trends toward 143% first-year ROI. By Q4 2026, full deployment reduces maintenance costs 25%. By 2027, the facility wins contracts with uptime guarantees competitors cannot match. By 2028, the 10x ROI is realized and competitive advantage is established.
The Competitive Gap Forms in 2026
The competitive gap forms in 2026. Early adopters build 10 to 15% efficiency advantages that compound over time. The 2026 budget decision determines whether your facility leads or follows through 2027 and 2028. The data supports immediate action: 95% positive ROI documented, 73% payback within 12 to 18 months, market accelerating toward $47.8 billion by 2029.
The risk is not in adopting predictive maintenance. The documented returns remove that uncertainty. The risk is in delaying adoption while competitors capture efficiency gains that translate into contract wins and market share growth.
Budget approvals lock in January 2026. The competitive window is the next 30 days.
FAQs
27% of implementations achieve payback within 12 months, with 73% reaching positive ROI within 12 to 18 months. High-downtime equipment shows six to nine month payback. Conservative projections use 12 to 15 months, but documented returns average 143% first year and 10x over three years.
Yes. External IoT sensors mount to existing equipment without replacement. Vibration, thermal, and acoustic sensors work on equipment manufactured in the 1990s. Wireless data transmission eliminates wiring requirements. Cloud processing removes the need for on-premise servers. Typical retrofit cost runs $3,000 to $5,000 per asset.
AI must learn equipment’s normal operating patterns before detecting anomalies. Rushing baseline creates 60% false positive rates, destroying operator trust. Month four typically shows first prevented failure. Baseline investment prevents false alarms that kill adoption and waste the entire deployment.
Predictive systems provide two to four weeks advance warning typical, depending on failure mode. Bearing degradation shows three to four weeks advance notice. Thermal issues present one to two weeks warning. This enables planned maintenance during scheduled downtime instead of emergency repairs costing three to five times more.
Typical $450,000 for 40 to 50 critical assets covering sensors ($120,000), software platform ($150,000), integration ($80,000), installation ($60,000), and training ($40,000). Automotive supplier case showed $250,000 investment generating $890,000 year one savings and $2.8 million by year three.