Key Takeaways
- Puerto Rico industrial electricity: 24.42¢/kWh vs 9.29¢ mainland = 163% premium,fundamentally changing equipment ROI calculations and making energy efficiency the primary asset decision variable
- Same equipment, opposite decisions: Grid-dependent facilities (Tier 1) repair despite obvious ROI; energy-independent facilities (Tier 3) replace aggressively,context determines strategy
- Energy efficiency gains compound 3x faster in Puerto Rico,20% inefficient equipment wastes $37,872/year vs $14,400 mainland, making replacement payback under 12 months
- $185 million Green Energy Fund offers up to 50% rebates on microgrids, transforming $2M projects into $400K net investments with 6-month paybacks
- CooperVision’s $500M expansion proves the model: 23.3 MW microgrid delivered 100% uptime during Hurricane Fiona when competitors went completely dark for weeks
- Hurricane vulnerability creates asset paradox: Math says replace, uncertainty says repair,only energy independence breaks the vicious cycle
In Australia’s alpine regions, scientists discovered something remarkable about Bogong moths: these insects with brains smaller than a pinhead navigate 600+ miles through treacherous terrain using the stars. Billions of young moths fly from southeast Australia to cool caves in the Australian Alps each year, guided by celestial patterns invisible to human eyes.
Researchers glued tiny metal rods to 400 moths’ backs and placed them in arenas under reproduced night skies. Despite brains the size of a grain of sand, the moths showed neural activity spikes when stars aligned in specific patterns,and navigated perfectly every time. They weren’t using memory or landmarks. They were using fixed points in the sky as anchors for decisions in uncertain environments.
Meanwhile, in Puerto Rico’s pharmaceutical manufacturing corridor, operations directors face their own 600-mile navigation challenge,except their hostile terrain isn’t alpine cold, it’s 24.42¢/kWh electricity (163% above mainland’s 9.29¢) and hurricanes that leave the island completely dark for weeks.
Two facilities sit eight miles apart in Aguadilla. Same industry, similar production capacity, identical products. Plant A pays $2.2 million annually for energy. Plant B pays $600,000. The $1.6 million gap isn’t luck or better rates,it’s infrastructure strategy.
When Plant A’s operations director evaluates equipment decisions, the math is brutal: A compressor repair costs $12,000, replacement costs $45,000. At 24.42¢/kWh, that inefficient compressor wastes $55,893 annually,replacement pays back in 10 months. Yet every capex request gets rejected with the same question: “Should we even be in Puerto Rico?”
Plant B operates differently. Their 23.3 MW Combined Heat & Power microgrid delivered 100% uptime during Hurricane Fiona while the island grid failed completely. When competitors went dark for weeks, they captured market share and proved facility viability. Their equipment strategy mirrors mainland logic,aggressive replacement prioritizing efficiency,because their fixed-cost energy acts like those moths’ stellar compass: a stable navigation point enabling optimal decisions.
This isn’t about which brand of compressor to buy. It’s about whether your facility has the energy equivalent of a stellar compass,or is navigating blind through a 163% premium environment that makes every asset decision a referendum on Puerto Rico viability.
When Energy Costs 163% More, Equipment Decisions Become Survival Decisions
The energy crisis hitting Puerto Rico manufacturing isn’t temporary rate volatility,it’s a structural cost premium that fundamentally alters equipment economics.
The Current Reality: $1.6 Million Before You Start
July 2025 Electricity Rates (U.S. Energy Information Administration data):
| Sector | Puerto Rico | US Mainland | Premium |
| Industrial | 24.42¢/kWh | 9.29¢/kWh | +163% |
| Commercial | 25.71¢/kWh | 14.15¢/kWh | +82% |
| Residential | 22.64¢/kWh | 17.47¢/kWh | +30% |
For a mid-sized pharmaceutical manufacturer consuming 10 million kWh annually, these numbers translate to existential math:
- Mainland facility energy cost: $929,000 annually (@ 9.29¢/kWh)
- Puerto Rico facility energy cost: $2,442,000 annually (@ 24.42¢/kWh)
- Annual disadvantage: $1,513,000 = losing before first product ships
Over a 15-year equipment lifecycle,the typical planning horizon for capital assets,that premium compounds to $22.7 million in additional energy costs for identical production. When the energy premium alone exceeds most facilities’ total capex budget, traditional equipment decision frameworks collapse.
Why Rates Are This High (And Staying There)
The 163% premium isn’t price gouging,it’s the accumulated weight of decades of infrastructure failure:
PREPA Bankruptcy: $9 billion debt service embedded in rates, creating structural cost floor that won’t disappear. Aging grid: 70% of transmission infrastructure over 40 years old, requiring massive capital investment funded through rates. Hurricane recovery: Still absorbing Maria (2017) and Fiona (2022) damage costs, with no insurance market to spread risk. Oil dependency: 47% of generation from imported petroleum vs. 1% on mainland, creating fuel cost volatility. Scale disadvantage: Small isolated grid (3.2 GW peak vs. 800+ GW mainland) lacking interconnection benefits.
Recent trajectory confirms rates aren’t improving:
- June 2024: 4.6% rate increase approved, raising industrial from 23.27¢ to 24.42¢/kWh
- Historical peak: 26.48¢/kWh (219% premium) during oil price spikes
- Projection: Rates remain elevated through 2026 pending grid modernization investments
For mainland manufacturers, energy represents 15-25% of operating costs. For Puerto Rico manufacturers at 163% premium, energy represents 40-60% of total operating costs,the single largest line item dominating every financial decision.
How the Premium Changes Equipment Math
Traditional asset management assumes energy is secondary to capital costs. The 163% premium inverts that assumption.
Mainland Total Cost of Ownership (15 years):
Equipment purchase: $100,000 (40%)
Energy costs: $150,000 (60%)
Total TCO: $250,000
Puerto Rico Total Cost of Ownership (15 years):
Equipment purchase: $100,000 (13%)
Energy costs: $663,000 (87%)
Total TCO: $763,000
When energy is 6.6x the equipment purchase price, focusing on minimizing upfront capex becomes irrational. Yet traditional procurement processes,designed for mainland economics,still prioritize purchase price over lifecycle energy consumption.
The manufacturers recognizing this aren’t just surviving Puerto Rico’s energy crisis,they’re weaponizing the premium into competitive advantages mainland competitors can’t match.
Same Equipment, Opposite Decisions: The Three-Tiered Reality
Puerto Rico manufacturing exists in three parallel universes. Same island, same rates, completely different equipment strategies.
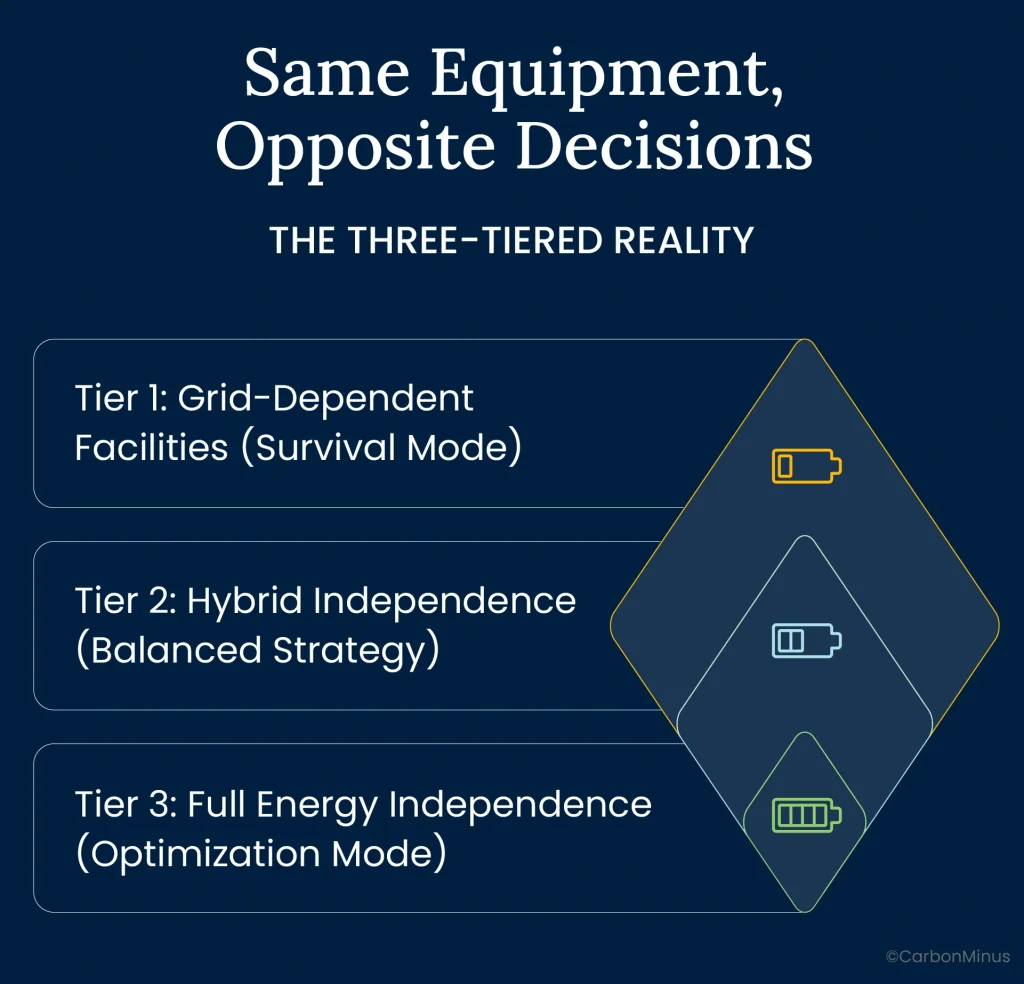
Tier 1: Grid-Dependent Facilities (Survival Mode)
Characteristics:
- 100% reliance on PREPA/LUMA grid for power,no backup beyond emergency diesel (hours, not days)
- Vulnerable to frequent blackouts: 100% grid loss during major hurricanes
- No independent generation, battery storage, or resilience infrastructure
- Facilities questioning Puerto Rico viability due to energy costs + hurricane risk
Equipment Decision Pattern: REPAIR BIAS (despite math favoring replacement)
Why obvious ROI gets rejected:
The operations director at Factory A (real facility, name withheld) presents this proposal:
- Compressor failure: $12,000 repair vs. $45,000 replacement
- Current compressor wastes $55,893/year due to 25% inefficiency (air leaks)
- Replacement payback: 10 months
- 15-year savings: $838,395
CFO response: “REPAIR”
His explanation: “We’re not making long-term bets on Puerto Rico viability. Board is discussing Jacksonville relocation. Minimize capex until we decide facility future. Every dollar spent here is a dollar we can’t spend on mainland transition.”
The vicious cycle:
- High energy costs → Question facility viability
- Facility uncertainty → Defer equipment investments (even with clear ROI)
- Deferred investments → Equipment becomes more inefficient
- Increased inefficiency → Energy costs rise further
- Rising costs → Question facility viability MORE
Real-world impact: Factory A lost $2.3 million in Hurricane Fiona,equipment surge damage plus two weeks offline. That loss triggered formal relocation analysis to Jacksonville. Now every capex request is evaluated through “are we throwing good money after bad?” lens.
Asset paralysis: Can’t justify investments that make facility viable because viability itself is questioned.
Tier 2: Hybrid Independence (Balanced Strategy)
Characteristics:
- 20-40% renewable generation: Solar panels (1-3 MW typical)
- Battery storage: 4-8 hours backup (500 kWh – 2 MWh)
- Grid-connected for optimization: Use cheapest source (sun, battery, or grid)
- Backup generators for extended outages
Equipment Decision Pattern: BALANCED (traditional 50% rule + energy efficiency)
Why moderate confidence enables action:
Mid-tier manufacturer (2 MW solar + 500 kWh battery + diesel backup) survived Hurricane Fiona with 80% uptime while grid-only competitors went completely dark. That resilience demonstration changed internal calculus.
CFO now approves equipment replacements with 4-5 year paybacks (vs. 1-year requirement for Tier 1). Partial energy independence = partial confidence in facility future.
Phased approach:
- Repair immediately to restore operations ($12,000 compressor bearing)
- Fix air leaks over 60 days (~$8,000 investment)
- Leak repairs save $30,000/year alone,quick win proving ROI
- Build business case for compressor replacement using leak fix savings as proof
- Position replacement as part of broader microgrid expansion (GEF incentive eligible)
Challenge: Energy efficiency gains only partially captured,facility still grid-dependent 60-70% of the time, so efficiency improvements deliver 60-70% of theoretical savings.
Tier 3: Full Energy Independence (Optimization Mode)
Characteristics:
- Comprehensive microgrid: Solar + battery + Combined Heat & Power (CHP)
- 100% uptime capability even during island-wide blackouts
- Hurricane-hardened: Engineered to withstand Category 5 winds
- Predictable, fixed energy costs independent of PREPA rate fluctuations
Equipment Decision Pattern: AGGRESSIVE REPLACE (efficiency compounds over stable operations)
Why strategy transforms completely:
CooperVision (contact lens manufacturing, Aguadilla) operates a 23.3 MW CHP system delivering 100% energy independence. During Hurricane Fiona (September 2022), they achieved 100% uptime while the entire island grid failed for weeks.
Equipment strategy enabled:
- Long-term planning horizon: 15-20 years vs. 2-3 years for Tier 1
- Every 1% efficiency improvement compounds over stable multi-decade operations
- Energy savings = direct margin expansion into fixed-cost renewable energy
- 100% uptime during hurricanes = market share capture from dark competitors
Same compressor decision, completely different outcome:
Decision: REPLACE + OPTIMIZE ($45,000 compressor + $8,000 leak fixes)
CFO approval rationale:
- 10-month payback even without incentives
- 15-year NPV: $838,395 savings minus $53,000 investment = $785,395 net gain
- Part of $500 million expansion plan (CooperVision model)
- New compressor engineered for microgrid power quality tolerance
Strategic context: Equipment replacement is competitive advantage weaponization. While Tier 1 competitors defer investments questioning Puerto Rico viability, Tier 3 builds an efficiency moat that makes Puerto Rico MORE viable than mainland.
The proof: CooperVision announced a $500M expansion in October 2024, not DESPITE of the energy crisis, but BECAUSE microgrids solved it.
Why the Traditional 50% Rule Dies at 24.42¢/kWh
For decades, equipment replacement decisions followed a universal heuristic: if repair costs exceed 50% of replacement cost, replace the asset. Below 50%? Repair and extend the life.
That rule was built for mainland economics where energy was cheap and capital was expensive. Neither assumption holds in Puerto Rico.
When the Rule Was Right (And Why It Isn’t Now)
1970s-1980s Manufacturing Environment (when 50% rule developed):
- Industrial electricity: 3-5¢/kWh nationally
- Energy = 10-15% of total operating costs
- Capital preservation dominated thinking: Equipment purchases were major expenditures relative to operating costs
- Energy efficiency gap between old and new equipment: Minimal (5-10%)
The 50% rule made sense: Repair cost as percentage of replacement cost was reasonable proxy for economic decision because energy was too cheap to matter.
2025 Puerto Rico Environment:
- Industrial electricity: 24.42¢/kWh (163% above mainland, 5-8x higher than 1970s)
- Energy = 40-60% of total operating costs
- Energy efficiency gap between old and new equipment: Massive (20-30%)
- Energy cost dominates TCO: Purchase price almost irrelevant
The 50% rule fails catastrophically: It ignores the variable that now determines 60-75% of total asset cost.
The Modified Framework for Extreme Energy Costs
Seven Variables Ranked by Puerto Rico Impact (adapted from traditional asset management):
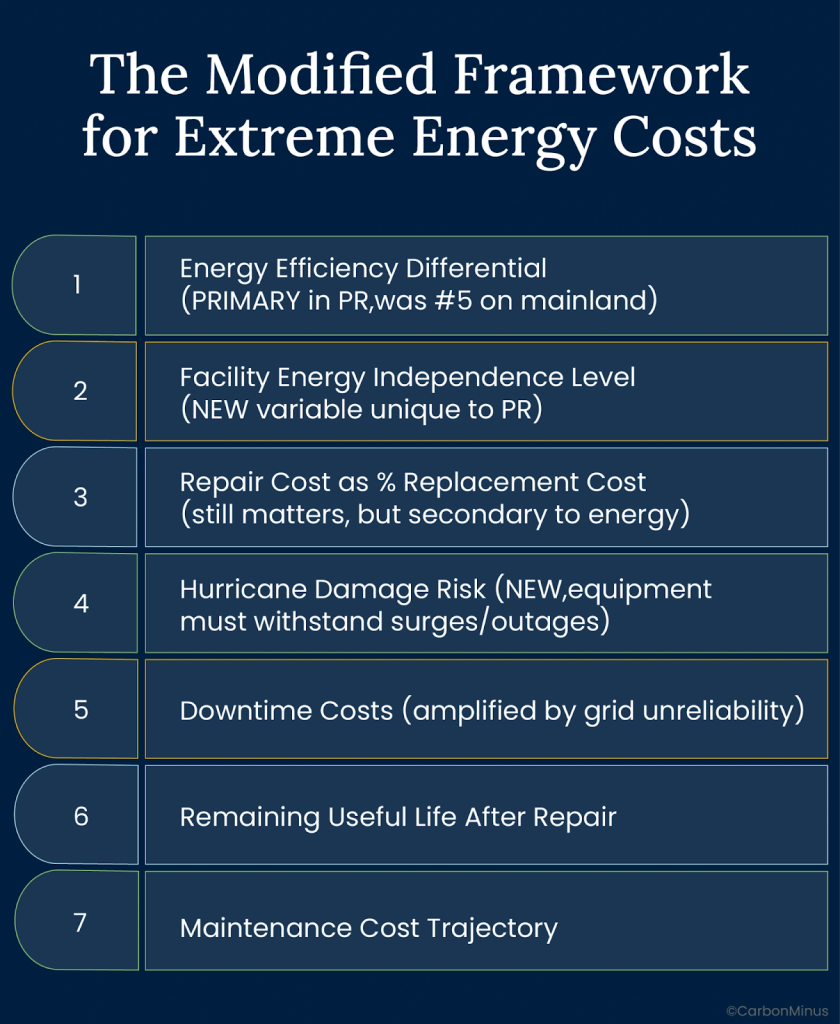
1. Energy Efficiency Differential (PRIMARY in PR,was #5 on mainland)
Calculate: (Current kWh – Efficient kWh) × $0.2442/kWh × Annual operating hours
At 24.42¢/kWh, equipment consuming 20% more energy than modern equivalent costs $11,850/year excess per 100 HP motor. Over 15 years: $177,750 (vs. $67,500 mainland). That’s 1.8x the motor purchase price wasted through inefficiency.
2. Facility Energy Independence Level (NEW variable unique to PR)
- Tier 1 (grid-dependent): Repair bias regardless of math (facility uncertainty trumps ROI)
- Tier 2 (hybrid): Balanced decisions using traditional framework + energy efficiency
- Tier 3 (energy-independent): Aggressive replace (efficiency compounds on stable microgrid)
Same equipment, same failure, opposite optimal decisions based solely on facility energy context.
3. Repair Cost as % Replacement Cost (still matters, but secondary to energy)
- Under 30%: Strong repair candidate (unless energy gap severe)
- 30-50%: Energy efficiency becomes tiebreaker
- 50-70%: Likely replacement, especially with energy gap
- Over 70%: Replace immediately
4. Hurricane Damage Risk (NEW,equipment must withstand surges/outages)
Does new equipment offer:
- Better surge protection for frequent power quality events?
- Faster restart capability after grid restoration?
- Lower risk of catastrophic failure during voltage fluctuations?
Tier 1 reality: Hurricane risk creates “repair until failure” mentality,every long-term asset is liability
5. Downtime Costs (amplified by grid unreliability)
Emergency repairs cost 3-5x more than planned maintenance due to overtime labor, expedited parts, and production losses. For pharmaceutical manufacturers, downtime costs $260,000/hour (FDA compliance + lost production).
Grid instability means higher failure frequency, increasing emergency repair probability.
6. Remaining Useful Life After Repair
Will repair genuinely extend asset life 2+ years, or just defer inevitable replacement? Equipment 90% through lifecycle rarely worth repairing,especially when replacement delivers 163% amplified energy savings.
7. Maintenance Cost Trajectory
Are repair costs escalating quarterly? Failure frequency increasing? Equipment requiring emergency repairs multiple times annually signals end-of-life regardless of repair-to-replacement ratio.
The Puerto Rico Decision Matrix
Apply this framework to make consistent asset decisions:
| Repair/Replace Ratio | Energy Waste/Year | Your Tier | Decision |
| < 30% | < $10,000 | Tier 1 | REPAIR (minimize capex) |
| < 30% | > $10,000 | Tier 3 | EVALUATE (energy may justify replacement) |
| 30-50% | Any amount | Tier 1 | REPAIR (uncertainty bias) |
| 30-50% | > $20,000 | Tier 3 | REPLACE (1-2 year payback) |
| 50-70% | Any amount | Any tier | REPLACE |
| > 70% | Any amount | Any tier | REPLACE NOW |
Critical insight: Energy waste annual cost is the decision variable, not repair/replace ratio. At 24.42¢/kWh, $20,000/year energy waste = replacement payback under 2 years for most equipment.
Three Real Decisions, Three Different Outcomes
Theory is useful. Calculations on real equipment are better. Here’s the same compressor failing in three facilities,and why each made a different decision.
Scenario 1: 200 HP Air Compressor – Tier 1 Facility
Equipment Profile:
- Industrial air compressor, 18 years old, bearing failure
- Repair cost: $12,000 (bearings, seals, labor)
- Replacement (new energy-efficient): $45,000
- Current inefficiency: 25% (combination of age + air leaks)
The Math (@ 24.42¢/kWh Puerto Rico rate):
Current annual energy cost:
- 200 HP × 0.746 kW/HP × 6,000 hours/year = 895,200 kWh
- 895,200 kWh × $0.2442/kWh = $218,576/year
Waste from 25% inefficiency (leaks + equipment degradation):
- 25% of $218,576 = $54,644/year wasted
New efficient compressor (+ leak repairs):
- Energy cost: $163,932/year (no leaks, high efficiency)
- Annual savings: $54,644
Payback calculation:
- ($45,000 – $12,000) / $54,644 = 0.60 years (7 months)
15-year waste if don’t replace: $54,644 × 15 = $819,660
The Decision: REPAIR ($12,000)
Why math doesn’t win:
Factory A lost $2.3M in Hurricane Fiona (equipment damage + lost production). Board is actively discussing Jacksonville relocation. CFO’s directive: “Minimize capex until facility future decided.”
Operations director: “I presented 7-month payback. CFO approved $12K repair instantly. Rejected $45K replacement without discussion. His exact words: ‘We’re not making long-term bets when Board might vote to relocate next quarter.'”
Outcome:
- Continues wasting $54,644 annually
- If facility stays 15 years: Lost $819,660 from deferring obvious investment
- Self-fulfilling prophecy: High costs drive relocation consideration that prevents cost-reduction investments
Scenario 2: Same Compressor – Tier 2 Facility
Same Equipment, Same Failure, Same Math
The Decision: HYBRID APPROACH
Why moderate confidence enables phased strategy:
Facility operates 2 MW solar + 500 kWh battery + diesel backup. Survived Hurricane Fiona with 80% uptime while grid-only competitors went completely dark. Partial energy independence = partial confidence in facility longevity.
Phased Implementation:
Month 1: Repair immediately ($12,000) to restore operations
- Can’t afford production downtime while replacement ordered
- Repair buys time to build comprehensive business case
Months 2-3: Fix air leaks (~$8,000 investment)
- Leak repairs save $30,000/year alone (single 1/8″ leak costs $10,257/year in PR)
- Quick win demonstrates ROI to skeptical CFO
Month 4: Build replacement business case
- Use 3 months of leak-fix savings data as proof
- Position compressor replacement as part of broader microgrid expansion
- Apply for GEF Tier 2 incentive (up to 50% rebate if part of energy system)
Month 12: Replace compressor ($45,000, potentially $22,500 net after GEF)
- CFO approves using leak-fix savings as demonstrated ROI
- Phased approach managed capital constraints while capturing value
Outcome:
- Year 1: $30,000 savings from leaks (minus $8,000 investment) = $22,000 net gain
- Years 2-15: $54,644/year savings from efficient compressor = $765,416 total
- Total 15-year gain: $787,416 (minus $53,000 total investment) = $734,416 net
Lesson: Phased approach captures immediate wins while building toward strategic replacement.
Scenario 3: Same Compressor – Tier 3 Facility
Same Equipment, Same Failure, Same Math
The Decision: REPLACE + OPTIMIZE IMMEDIATELY ($45,000 + $8,000 leak fixes)
Why aggressive strategy wins:
Facility operates 23.3 MW CHP microgrid (CooperVision model) delivering 100% energy independence. During Hurricane Fiona: 100% uptime while island completely dark for weeks. Captured competitors’ orders and proved facility viability with $500M expansion plan.
CFO approval rationale:
“We don’t do repair vs. replace analysis anymore. We ask: ‘What’s the 15-year energy waste cost?’ If it exceeds equipment price, we replace. Simple.”
Financial analysis:
- 7-month payback even without incentives
- 15-year NPV: $819,660 savings minus $53,000 cost = $766,660 net gain
- GEF Tier 2 rebate (if eligible): 50% = $22,500 reduction → 4-month payback
- New compressor engineered for microgrid power quality and surge tolerance
Strategic context:
Part of $500M expansion where equipment replacement = competitive advantage. While Tier 1 facilities question Puerto Rico viability and defer investments, Tier 3 builds efficiency moat making Puerto Rico MORE competitive than mainland.
Operations director: “Our mainland competitors pay 9.29¢/kWh but operate inefficient equipment because ‘energy’s cheap.’ We pay zero for energy from our microgrid and operate the most efficient equipment on the planet. Who has the advantage?”
Outcome: Same equipment, same failure, three completely different decisions based solely on facility energy independence context
The $185 Million Game-Changer Nobody Knows About
The biggest barrier to Tier 3 energy independence isn’t technology,it’s CFOs who think microgrids cost $2 million with 8-year paybacks. The Puerto Rico Green Energy Fund transforms that equation.
How GEF Changes Everything
Puerto Rico Green Energy Fund: $185 Million Available
Tier 2: Industrial-Scale Projects (101 kW – 1 MW):
- Up to 50% rebate on eligible renewable energy system costs
- Covers: Solar arrays, battery storage, microgrid infrastructure, energy management systems, CHP equipment
- Typical project: $2M comprehensive microgrid → $1M net investment after 50% rebate
Puerto Rico Incentives Code (formerly Act 60):
- 4% fixed income tax rate for businesses generating own renewable energy (vs. 37.5% standard corporate rate)
- 75% property tax exemption on renewable energy equipment for 10 years
- No local sales tax on renewable equipment purchases
Federal Tax Credits (stack with PR incentives):
- Investment Tax Credit (ITC): 30% for solar + storage systems
- Modified Accelerated Cost Recovery System (MACRS): 5-year depreciation schedule
The Incentive Math That CFOs Can’t Refuse
Scenario: Mid-Sized Pharmaceutical Manufacturer
Current situation:
- Energy bill: $1.8M annually (@ 24.42¢/kWh)
- Grid-dependent (Tier 1), questioning facility viability
- Board discussing Jacksonville relocation
Proposed microgrid:
- 4 MW solar array: $2.8M
- 2 MWh battery storage: $1.4M
- 1.5 MW CHP system: $2.3M
- Gross project cost: $6.5M
Without incentives (traditional CFO analysis):
- Projected annual savings: $900,000 (50% energy cost reduction)
- Payback: $6.5M / $900,000 = 7.2 years
- CFO verdict: “Too long,REJECTED”
With full incentive stack (informed CFO analysis):
- Federal ITC (30%): -$1,950,000
- GEF Tier 2 rebate (50% on eligible): -$3,250,000
- Net investment after incentives: $1,300,000
- Annual savings: $900,000
- Payback: 1.4 years (17 months)
- CFO verdict: “Highest ROI capex available,APPROVED”
Additional benefits (not in payback calculations):
- 4% income tax rate: ~$200K/year corporate tax savings
- 75% property tax exemption: ~$50K/year savings
- 100% uptime during hurricanes: Priceless for pharmaceutical FDA compliance
- Customer security: Supply chain resilience competitive advantage
Total annual benefit: $900K energy + $200K tax + $50K property = $1,150,000
Revised payback: $1.3M / $1.15M = 1.1 years (13 months)
How Incentives Transform Equipment Strategy
Before Microgrid (Tier 1):
- Equipment decisions: Repair bias (facility uncertainty)
- CFO mindset: “Minimize capex until Board decides facility future”
- 15-year equipment waste: $819,660 (deferred compressor replacement)
After Microgrid (Tier 3):
- Equipment decisions: Aggressive replace (efficiency compounds on stable energy)
- CFO mindset: “What’s the 15-year waste cost? Replace if exceeds equipment price.”
- 15-year equipment savings: $766,660 (immediate compressor replacement)
Delta: $1,586,320 equipment value creation over 15 years from facility tier migration
Your Five-Step Asset Decision Process for Puerto Rico
Traditional repair-vs-replace calculators built for mainland economics fail catastrophically in Puerto Rico. Here’s the framework that works:
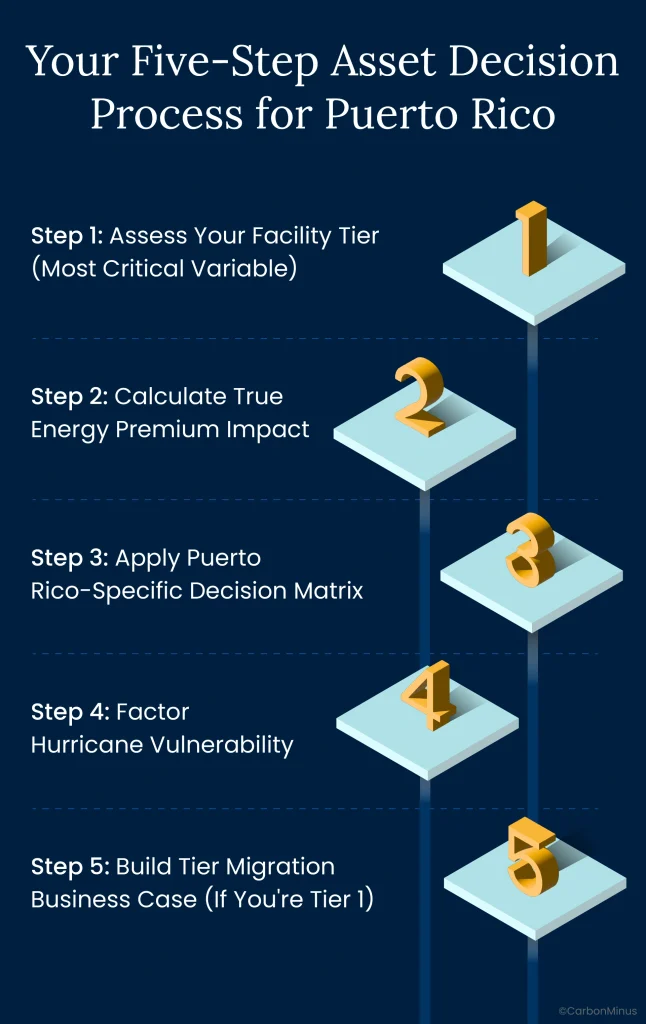
Step 1: Assess Your Facility Tier (Most Critical Variable)
Tier 1 – Grid-Dependent:
- 100% PREPA/LUMA power, emergency backup only
- Equipment strategy: REPAIR BIAS regardless of math (facility uncertainty trumps ROI)
- Decision mindset: “Should we even be in Puerto Rico?”
- If this is you: Calculate Tier 1 penalty costs (see Step 5)
Tier 2 – Hybrid Independence:
- 20-40% renewable generation, 4-8 hour battery
- Equipment strategy: BALANCED (traditional 50% rule + energy efficiency)
- Decision mindset: “Phased optimization while building toward full independence”
Tier 3 – Energy Independent:
- 100% microgrid capability, hurricane-hardened
- Equipment strategy: AGGRESSIVE REPLACE (efficiency compounds on stable operations)
- Decision mindset: “What’s the 15-year waste cost?”
Why this step matters: Same equipment, opposite optimal decision based solely on facility tier.
Step 2: Calculate True Energy Premium Impact
Formula for Puerto Rico (@ 24.42¢/kWh):
Annual Energy Waste = (Current kWh – Efficient kWh) × $0.2442/kWh
For equipment with 20% inefficiency (common for aging assets):
- 100 HP motor: $11,850/year energy waste
- 200 HP compressor: $54,644/year energy waste
- 500 HP chiller: $148,995/year energy waste
Compare to equipment cost (this reveals the absurdity):
- 100 HP motor: $22,000 purchase price → Energy waste = 0.54x equipment cost ANNUALLY
- 200 HP compressor: $45,000 purchase price → Energy waste = 1.21x equipment cost ANNUALLY
- Over 15 years: Energy waste = 8-18x equipment purchase price
Mainland comparison (@ 9.29¢/kWh):
- Same 200 HP compressor waste: $20,793/year (vs. $54,644 Puerto Rico)
- Puerto Rico energy waste is 2.6x higher for identical equipment
Step 3: Apply Puerto Rico-Specific Decision Matrix
Use this framework (not mainland repair-vs-replace calculators):
For Tier 1 Facilities (Grid-Dependent):
- Repair/Replace Ratio < 50% + Energy waste > $30K/year = REPAIR (facility uncertainty overrides math)
- Repair/Replace Ratio > 70% + Any energy waste = REPLACE (forced by failure)
- Reality: Math rarely matters,facility viability question dominates every decision
For Tier 2 Facilities (Hybrid):
- Repair/Replace Ratio < 30% + Energy waste < $15K/year = REPAIR
- Repair/Replace Ratio 30-50% + Energy waste > $20K/year = REPLACE (3-5 year payback acceptable)
- Repair/Replace Ratio > 50% + Any energy waste = REPLACE
For Tier 3 Facilities (Energy Independent):
- Ask single question: “Does annual energy waste exceed equipment cost difference?”
- If YES: REPLACE (payback under 1 year)
- If NO: Evaluate remaining useful life and maintenance trajectory
Step 4: Factor Hurricane Vulnerability
Questions to answer:
- Can current equipment tolerate PREPA power surges/sags that occur weekly?
- Does new equipment offer better surge protection?
- What’s hurricane damage replacement cost if Category 5 destroys facility?
- Does new equipment enable faster restart after grid restoration?
Tier 1 reality: Hurricane risk creates “repair until catastrophic failure” mentality regardless of obvious efficiency ROI
Tier 3 reality: Hurricane-hardened infrastructure enables long-term planning that makes efficiency investments rational
Step 5: Build Tier Migration Business Case (If You’re Tier 1)
If you keep choosing REPAIR despite math saying REPLACE, your problem isn’t equipment decisions,it’s facility tier.
Calculate your Tier 1 penalty costs:
1. Annual equipment waste from deferred replacements:
- Identify 10 worst-performing assets
- Calculate energy waste using Step 2 formula
- Typical result: $150K-$400K annually wasted across asset base
2. Hurricane vulnerability exposure:
- Last hurricane cost (e.g., Factory A: $2.3M from Fiona)
- Probability of major hurricane: ~20% annually
- Expected annual cost: $460K ($2.3M × 20%)
3. Customer concentration risk:
- What if key pharmaceutical customer requires supply chain resilience certification?
- Contract value at risk: Often $5-50M annually
Sum of these three = maximum investment in tier migration that delivers positive ROI
Example:
- Equipment waste: $250K/year
- Hurricane risk: $460K/year
- Customer risk: $10M contract (20% defection probability) = $2M/year
- Total Tier 1 penalty: $2.71M annually
Microgrid cost after incentives: $1.3M net
Payback from avoided Tier 1 penalties alone: 5.7 months
Energy savings: Bonus ROI on top
The CooperVision Proof: How $500M Expansion Makes Sense
Industry reaction to CooperVision’s October 2024 announcement: “Are they insane?”
Puerto Rico manufacturers are leaving. Energy costs are killing margins. Hurricanes destroy facilities. Why would anyone invest $500 million?
The answer reveals everything wrong with conventional Puerto Rico analysis.
What CooperVision Did Differently
The Strategy (that everyone else missed):
Phase 1: Energy Independence FIRST (2021-2023)
- Built 23.3 MW Combined Heat & Power (CHP) system
- 100% energy independence from PREPA/LUMA grid
- Hurricane-hardened for Category 5 winds
- Fixed, predictable energy costs decoupled from utility rates
Phase 2: Validate During Crisis (September 2022)
- Hurricane Fiona: 100% uptime while island completely dark for weeks
- Competitors offline, unable to deliver
- Captured market share from facilities that couldn’t produce
- Proved supply chain resilience competitive advantage
Phase 3: Expansion AFTER Proving Model (October 2024)
- Announced $500M investment expanding Puerto Rico capacity
- Not DESPITE energy crisis,BECAUSE microgrid solved it
- Facility viability no longer questioned,demonstrated with hurricane performance
The Equipment Strategy Transformation
Before Microgrid (Tier 1 mentality, hypothetical):
- Equipment decisions: Repair bias
- CFO blocks investments: “Facility future uncertain”
- 15-year equipment waste: ~$40M (large facility scale)
After Microgrid (Tier 3 reality):
- Equipment decisions: Aggressive replace prioritizing efficiency
- CFO approves: “What’s the 15-year waste cost?”
- 15-year equipment savings: ~$60M (efficiency compounds on stable energy)
Delta: $100M equipment value creation over 15 years from facility tier migration
The $500M expansion math:
- Energy costs: Fixed (microgrid) vs. volatile 24.42¢/kWh grid rate
- Hurricane resilience: 100% uptime vs. weeks offline (competitors)
- Equipment optimization: $100M lifecycle advantage from Tier 3 strategy
- Tax incentives: 4% income rate (vs. 37.5% standard) + 75% property tax exemption
- Labor costs: 40% below mainland (even factoring higher energy)
Total cost of ownership: Puerto Rico + microgrid beats Jacksonville + cheap energy
The Lesson Most Manufacturers Miss
CooperVision didn’t expand DESPITE Puerto Rico’s problems. They solved energy independence FIRST, which made expansion MORE attractive than mainland alternatives.
Tier 1 manufacturers ask: “Should we stay in Puerto Rico?”
Tier 3 manufacturers ask: “Why would we leave when we have advantages mainland can’t match?”
The difference is energy independence as strategic foundation, not energy cost as insurmountable problem.
The Equipment Decision That’s Really a Facility Decision
Plant managers asking “Should we repair this compressor?” are asking the wrong question.
The real question: Are we Tier 1, Tier 2, or Tier 3?
Because that determines whether math matters or uncertainty trumps math. Whether $54,644/year energy waste justifies $33,000 replacement investment (obvious ROI), or whether facility viability uncertainty makes every capex dollar a bet on Puerto Rico’s future that CFOs won’t approve.
The $42M Question Answered
The title promised an answer to the $42M equipment question. Here it is:
For a mid-sized facility over 15-year equipment lifecycle:
- Energy premium: $22.7M (163% × 15 years × annual consumption)
- Equipment purchases/replacements: $15M (typical capex cycle)
- Hurricane damage risk: $4.6M ($2.3M × 2 major hurricanes)
- Total at stake: $42.3M
For Tier 1 facilities (grid-dependent):
- That $42M feels like sunk cost in environment you’re planning to exit
- Every equipment decision is referendum on facility viability
- Result: Repair bias, deferred investments, rising costs, relocation discussion
For Tier 3 facilities (energy-independent):
- That $42M becomes $18M through efficiency + microgrid independence
- Equipment decisions enable value capture, not survival mode
- Result: Aggressive optimization, compounding advantages, expansion investment
The $24M difference determines competitive viability.
Your Path Forward
If you’re Tier 1: Calculate annual loss from deferred equipment replacements + hurricane exposure + customer risk. That sum = maximum investment in tier migration. GEF incentives reduce effective cost 50-70%, transforming “unaffordable” into “can’t refuse”.
If you’re Tier 2: Build comprehensive microgrid business case using monitoring data proving current waste. Position as completing energy independence journey, not starting from zero.
If you’re Tier 3: You already know,keep optimizing, keep replacing inefficient assets, keep weaponizing Puerto Rico’s energy premium into competitive advantages mainland can’t match.
Equipment decisions become rational when facility foundation is stable. Energy independence isn’t the goal, it’s the prerequisite for making smart asset decisions in Puerto Rico’s 163% premium environment.
Calculate Your Tier Migration ROI
CarbonMinus delivers real-time energy monitoring that quantifies equipment waste BEFORE microgrid investment, builds GEF-ready business cases with audit-proof data, and navigates Puerto Rico-specific incentives (50% rebates + 30% ITC + 4% tax rate) that transform $2M gross projects into $400K net investments with 6-month paybacks.
Stop making equipment decisions in survival mode. Calculate your Tier 1 penalty costs and see how energy independence transforms asset strategy from repair bias to optimization.
FAQs
1. Our CFO says we can’t afford $2M microgrid investment. Are we stuck in Tier 1 forever?
No. Puerto Rico Green Energy Fund (GEF) Tier 2 covers up to 50% ($1M on $2M project), federal ITC adds 30% ($600K), reducing net investment to $400K. Phased approach possible: start with solar ($500K-$800K net after incentives) achieving 40-60% energy independence. Monthly energy savings ($40K-$70K) can service financing, making effective cash outlay near zero.
2. We’re a small manufacturer (under 500 kW demand). Do these strategies apply to us?
Yes. GEF Tier 1 covers smaller projects (5-100 kW) with up to 40% rebates. A 300 kW facility achieves energy independence with $600K-$900K gross investment → $250K-$350K net after incentives. Equipment decision principles identical: at 24.42¢/kWh, a 50 HP motor wasting 20% costs $5,925/year vs $2,250 mainland, replacement payback under 18 months.
3. What if PREPA rates decrease in future, won’t that make efficiency investments less valuable?
Even with optimistic 20% rate drop, Puerto Rico industrial would be 19.5¢/kWh = still 110% premium vs mainland 9.29¢/kWh. Same compressor efficiency saving drops from $54,644 to $43,715/year, payback extends from 7 to 9 months, still compelling. Microgrid provides hurricane resilience value (100% uptime) independent of rate levels.
4. Our Board is discussing mainland relocation. How do we know Puerto Rico + microgrid beats Jacksonville?
Total cost of ownership comparison: Jacksonville saves $1.365M energy BUT pays $800K more labor + $300K more real estate + $650K more taxes (21% federal + 6% state vs 4% PR rate) + $200K more logistics = $585K higher total costs. Add microgrid (net $400K investment after incentives, $900K annual savings): Puerto Rico beats Jacksonville by $1.485M annually.
5. What if we invest $400K in microgrid then Board decides to relocate anyway?
Mitigate risk with phased approach: deploy energy monitoring first ($50K-$100K) to quantify waste and build data-driven business case. Monitoring pays for itself identifying first major leak (single 1/8″ leak costs $10,257/year in PR). Use 3-6 months data demonstrating equipment waste ($150K-$400K annually typical) and hurricane vulnerability costs. If Board votes relocation, monitoring equipment is portable to mainland.
6. Can equipment decisions really differ that much between Tier 1 and Tier 3 for identical equipment?
Yes. Same 200 HP compressor ($12K repair vs $45K replacement, 7-month payback): Tier 1 chooses repair despite math because facility uncertainty trumps ROI, CFO says “minimize capex until Board decides future”. Tier 3 chooses replace because 15-year NPV = $766,660 net gain and facility confidence enables rational economic decisions. Paradox reflects different viability contexts: Tier 1 faces existential question; Tier 3 answered it with microgrid.
7. What’s first step for facility currently in Tier 1 considering tier migration?
Conduct energy audit calculating Tier 1 penalty costs: (1) Equipment waste from deferred replacements, identify 10 worst assets, calculate annual waste (typically $150K-$400K), (2) Hurricane vulnerability, last hurricane cost × 20% annual probability, (3) Customer concentration risk, contracts requiring supply chain resilience. Example: $250K equipment + $460K hurricane + $2M customer risk = $2.71M annual Tier 1 penalty. Microgrid $400K net = 1.8-month payback.
8. How does 163% energy premium change traditional 50% repair-vs-replace rule?
Traditional 50% rule fails catastrophically at 24.42¢/kWh because it ignores energy efficiency, now determining 60-75% of total asset cost. New priority: energy efficiency differential becomes PRIMARY variable (was #5 on mainland). At 163% premium, equipment consuming 20% more energy costs $11,850/year excess per 100 HP motor, over 15 years that’s $177,750 vs $67,500 mainland (1.8x the motor purchase price wasted).
9. What incentives beyond GEF can reduce microgrid investment costs?
Stack multiple programs: GEF Tier 2 (50% rebate up to $1M on eligible costs), Federal ITC (30% for solar + storage), Puerto Rico Incentives Code (4% fixed income tax rate vs 37.5% standard + 75% property tax exemption for 10 years), and MACRS (5-year depreciation schedule). Combined: $6.5M gross project becomes $1.3M net investment with 13-month payback from energy savings alone.
10. Why did CooperVision invest $500M in Puerto Rico expansion despite energy crisis?
They solved energy independence FIRST with 23.3 MW CHP microgrid delivering 100% uptime during Hurricane Fiona while island was completely dark for weeks. This proved facility viability: captured competitors’ orders, demonstrated supply chain resilience, enabled aggressive equipment replacement strategy saving ~$60M over 15 years. CooperVision didn’t expand DESPITE Puerto Rico’s problems, they solved energy independence, making expansion MORE attractive than mainland.
11. How quickly can microgrid investment improve our equipment decision-making?
Immediate transformation: Before microgrid (Tier 1), equipment decisions stuck in repair bias, CFO blocks investments, facility uncertainty dominates. After microgrid (Tier 3), aggressive replace strategy prioritizing efficiency, CFO approves asking “What’s 15-year waste cost?”, facility confidence enables rational ROI decisions. Delta: $1.59M equipment value creation over 15 years from facility tier migration alone, separate from energy savings.