Key Takeaways
- Manufacturing plants waste $510 for every $1,000 spent on electricity through inefficient equipment, compressed air leaks, and unoptimized processes
- Real-time energy monitoring delivers 4x better results than traditional audits, achieving 20% savings vs. 5% from conventional approaches
- Quick wins like LED lighting and air leak detection offer 40-90% energy savings with payback periods under 12 months
- Energy efficiency investments pay back in 18-20 months, not the 5-10 years most assume, with 70% of facilities reporting ROI above 10%
- The industrial energy efficiency market grows to $41.2 billion by 2030 at 8.6% CAGR, creating massive opportunities for early adopters
The Silent Money Hemorrhage Every Manufacturing Executive Must Face
Imagine paying your supplier for two truckloads of raw materials, but only one ever arrives at your loading dock. You’d launch an investigation. Heads would roll. You’d call it what it is: theft.
Yet, a heist of that exact magnitude is happening in your facility right now. And it’s silent.
For every $1,000 you spend on electricity, $510 vanishes into thin air before it does any productive work. It’s not a billing error. It’s the financial equivalent of setting half your cash on fire.
This isn’t a small leak; it’s a $3.2 billion annual hemorrhage across the manufacturing sector. What does $3.2 billion look like? It’s enough cash to build more than 30 brand-new, state-of-the-art smart factories from the ground up. Or, put another way, it’s the annual salary for an army of 35,000 skilled engineers—an army your competitors could be hiring with the money you’re wasting.
This waste streams from the familiar hums and hisses of your plant floor: compressed air leaks bleeding money 24/7, motors running at full power for no reason, and inefficient systems burning energy like it’s free. While you’re focused on optimizing production, nearly 40% of your energy spend is actively working against your bottom line.
Here’s the most critical part: your competitors who have caught on to this heist aren’t just cutting costs. They are capturing that wasted energy and weaponizing it. That reclaimed $510 per $1,000 is funding their R&D, subsidizing aggressive pricing, and fueling their expansion—all while you’re unknowingly paying their bills.
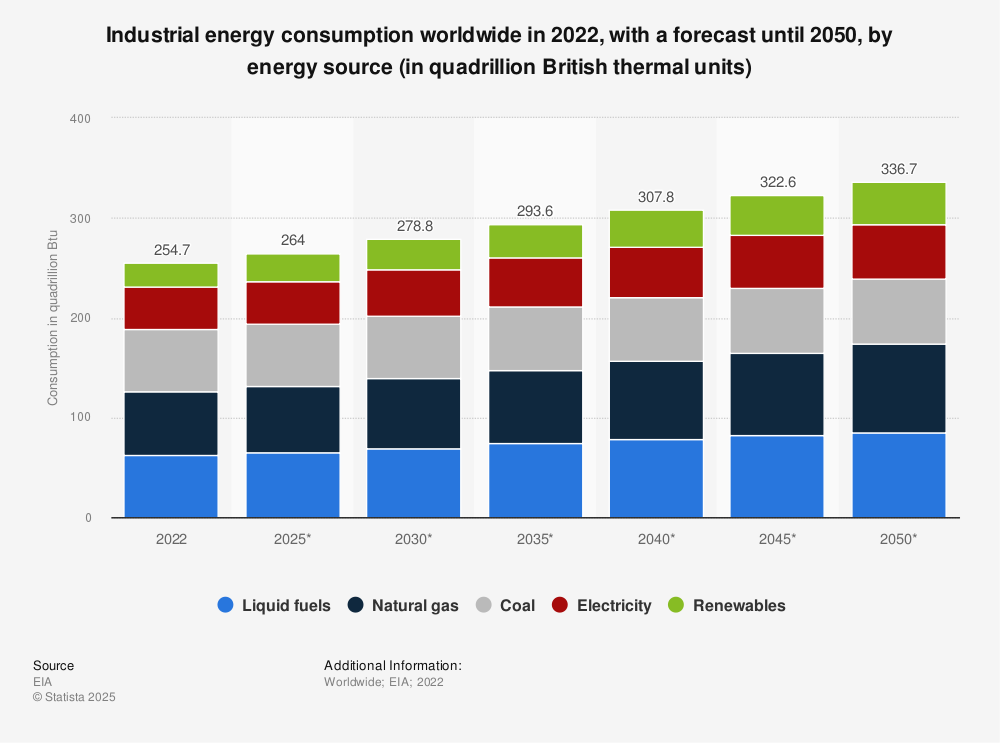
The industrial energy monitoring system and efficiency market is exploding toward $41.2 billion by 2030 for a reason. The smart money is moving to stop the bleeding. They’ve realized the secret is about energy management solutions rather than the energy bill.
The question isn’t whether you can afford to address energy waste.
The question is, can you afford to let the heist continue?
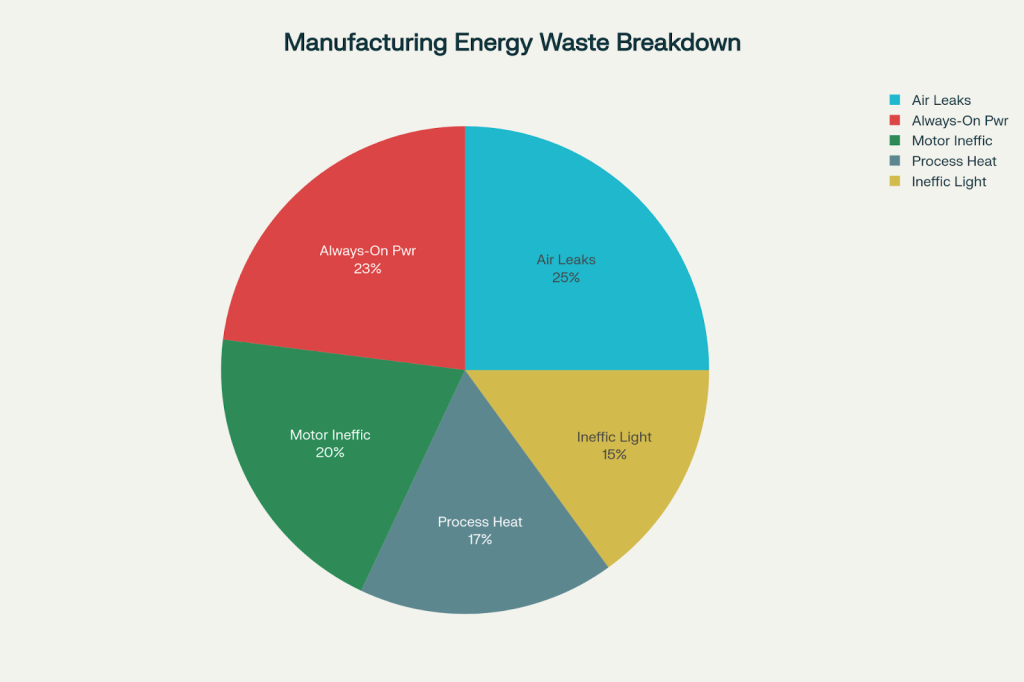
Manufacturing Energy Waste Sources and ROI Analysis for Efficiency Solutions
The Anatomy of a Profit Drain: Where Your Money Is Vanishing
For a plant manager, the factory floor is a landscape of controlled chaos. But hidden within the noise are three primary leaks quietly sinking your profitability. Think of it as peeling back the layers of an onion—the deeper you look, the more your eyes will water.
Layer 1: The Obvious Drains (That You’ve Learned to Ignore)
You walk past these every day. The low-hanging fluorescent tubes flickering in the warehouse are one. These energy vampires consume massive amounts of electricity and require constant replacement. The payback for switching to modern LEDs, which use 90% less energy and last 15 times longer, is often under 12 months. It’s the fastest cash you can find in your facility.
Layer 2: The Audible Leaks (The Hissing Sound of Money)
Next is the sound you’ve trained yourself to tune out: the constant hiss of compressed air leaks. That sound is pure profit escaping into the air. With 20-30% of compressor output lost to leaks, your system is running harder, facing more wear and tear, and driving up maintenance costs—all to produce air that does nothing.
A single leak from a tiny 1/8-inch (3mm) opening costs a facility over $2,300 a year. A 1/4-inch leak? That’s nearly $9,250 annually flushed away.
| Leak Size (Orifice Diameter) | Wasted Airflow (CFM) | Annual Energy Loss (kWh) | Annual Cost |
| 1/32 inch (~0.8 mm) | 1.6 CFM | 1,400 kWh | $140 |
| 1/16 inch (~1.6 mm) | 6.5 CFM | 5,800 kWh | $580 |
| 1/8 inch (~3.2 mm) | 25 CFM | 23,100 kWh | $2,310 |
| 1/4 inch (~6.4 mm) | 104 CFM | 92,500 kWh | $9,250 |
| 3/8 inch (~9.5 mm) | 234 CFM | 208,100 kWh | $20,810 |
Annual Cost Impact of Compressed Air Leaks by Orifice Size.
Source: https://fluidairedynamics.com/blogs/articles/how-to-detect-and-fix-compressed-air-leaks
The brutal math is simple: for a plant manager, ignoring that hiss is the same as approving a pointless, multi-thousand-dollar check to the utility company every year.
Layer 3: The Invisible Thieves (Heat and Standby Power)
The most dangerous waste is the kind you can’t see or hear.
- Process Heat: This consumes over half of all your onsite energy, and a third of it is simply lost as waste heat. That’s like paying for three truckloads of fuel and letting one of them drive right off a cliff.
- “Always-On” Power: This is the silent killer, accounting for up to 23% of a factory’s electricity bill. It’s the cost of paying for a “ghost shift”—a full shift’s worth of energy consumed by idle equipment producing nothing.
These are hidden taxes on your profitability that your competitors might already be eliminating.
The 4X Breakthrough: From Flying Blind to Flying in Control
Imagine trying to run your entire production schedule using a report from last year. You wouldn’t do it. Yet, that’s exactly what relying on a traditional, annual energy audit feels like. You get a single, outdated snapshot of what happened, leaving you blind to the costly waste happening on your floor right now.
Real-time energy monitoring flips the script. It’s the difference between an old photograph and a live, high-definition video feed of your entire operation. This is why it delivers up to 4x better results, achieving 20% savings compared to the mere 5% from a conventional audit.
The change is profound. You stop being a passive payer of energy bills and become actively involved in energy data management. You go from guessing to knowing.
From reacting to problems to preventing them before they start. You stop driving blindfolded and take the wheel with confidence.
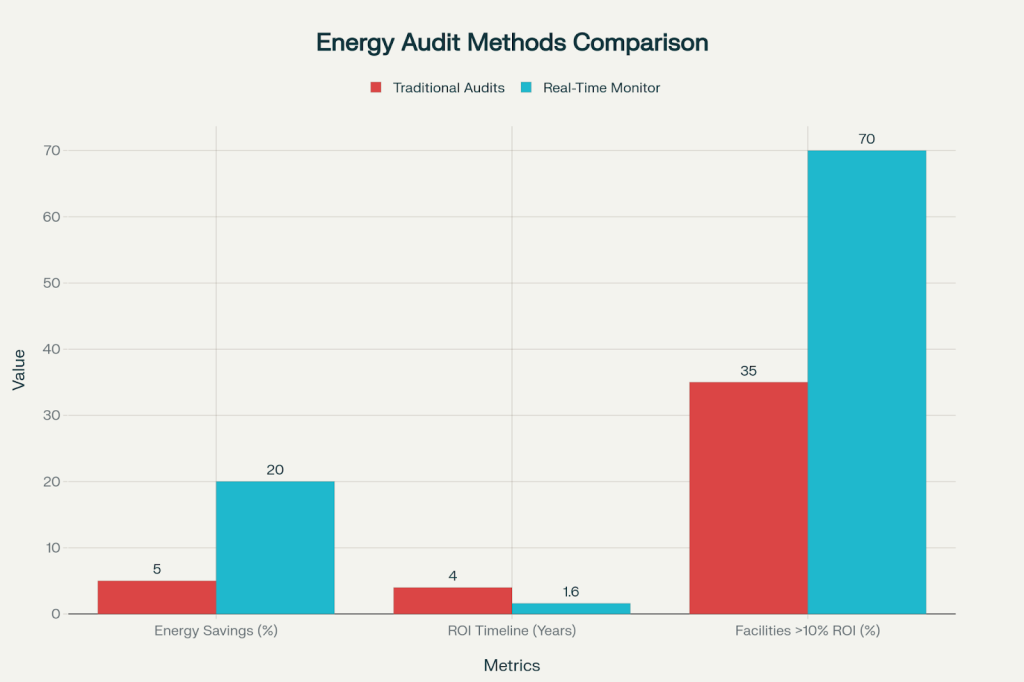
Traditional Energy Audits vs. Real-Time Monitoring: Effectiveness Comparison
The Modern Efficiency Playbook: A Blueprint from the Best
This is a proven blueprint for success.
When Google saved over $1 billion through its energy programs, it wasn’t by guessing. It was by implementing comprehensive real-time monitoring that exposed every hidden watt of waste. Similarly, when the JW Marriott cut its energy use by 16.5% in three years, saving nearly half a million dollars, it was using the same playbook.
These aren’t untouchable stories. They are previews of what becomes possible for any facility that decides to stop flying blind.
End the Reactive Maintenance Trap for Good
For most plant managers, “reactive maintenance” is a source of constant stress: the unexpected breakdown, the emergency repair costs, the derailed production schedule. Predictive maintenance powered by real-time energy data analytics is the cure.
By spotting anomalies in equipment energy use, you can predict failures before they happen. This approach is proven to reduce equipment failures by 14% and cut down on costly emergency repairs.
Think about what this means for your budget and your team. The energy you save becomes money you can reinvest. But more importantly, the downtime you prevent becomes production capacity you can sell, turning a maintenance headache into a new revenue opportunity.
Your Roadmap from Crisis to Competitive Advantage
Taking back control of your energy spend isn’t about a single, massive overhaul. It’s a strategic, three-phase journey that builds momentum, delivers continuous returns, and ultimately solidifies your competitive edge.
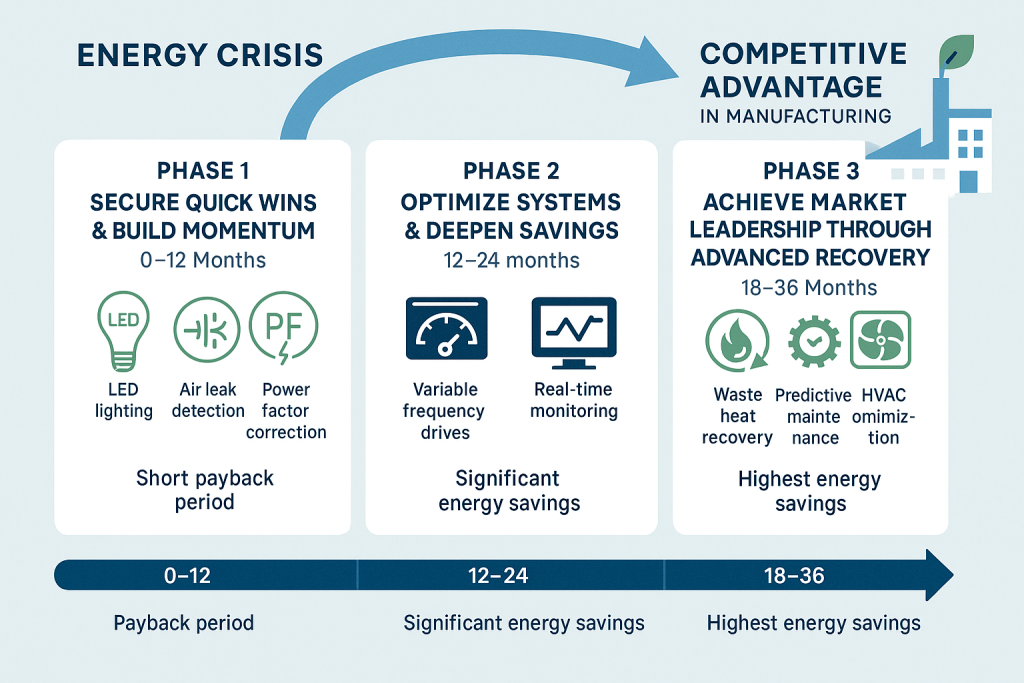
Phase 1: Secure Quick Wins & Build Momentum (Payback: 0–12 Months)
The goal here is simple: generate immediate cash flow and prove the ROI of energy efficiency to your team and stakeholders. These are the no-nonsense wins that fund the rest of your journey.
- LED Lighting Upgrades: This is the fastest win. By swapping out old lighting, you can achieve energy cost reduction by 40-90%. For a plant manager, this translates to a visibly lower electricity bill in the very first month, with a full payback in under a year.
- Compressed Air Leak Detection: Launch a “leak hunt” with ultrasonic detectors. Fixing these leaks can cut air-related energy waste to less than 10%, with the equipment often paying for itself in just a few months.
- Power Factor Correction: This is about eliminating pointless penalties from your utility bill. For a CFO, it’s a straightforward fix that stops a hidden cash drain, with payback periods as short as six months.
Phase 2: Optimize Systems & Deepen Savings (Payback: 12–24 Months)
With initial wins secured, you now have the momentum to tackle bigger opportunities. This phase is about making your core systems smarter and more efficient.
- Variable Frequency Drives (VFDs): Your motors are the heart of your operation, consuming nearly 70% of your electricity. Installing VFDs gives you precise control, cutting their energy use by 15-40%. This is one of the single biggest levers you can pull to reduce costs.
- Real-Time Energy Monitoring: This is the brain of your entire operation. By providing a live feed of your energy consumption, it unlocks 8-25% in cost reductions. It allows you to see exactly which lines or machines are driving up costs during a shift.
Curious to see what this level of visibility could mean for your specific operation? Use our CarbonMinus ROI calculator to get a personalized savings estimate based on your industry and annual energy spend.
Phase 3: Achieve Market Leadership Through Advanced Recovery (Payback: 18–36 Months)
This is the final frontier, where you move from being efficient to being dominant. You’re no longer just cutting waste; you’re turning it into a strategic asset.
- Waste Heat Recovery Systems: Up to 60% of your process energy is lost as waste heat. A recovery system captures this valuable asset and converts it back into usable energy, effectively recycling your energy dollars and dramatically reducing fuel costs.
- Predictive Maintenance Integration: With energy data analytics, you can predict machine failures before they happen. This powerful capability is proven to cut maintenance costs by 25-30% and extend equipment life, turning your maintenance team from a reactive crew into a proactive force for uptime and reliability.
The New ROI Reality: This isn’t a 10-Year Bet, it’s an 18-Month Payback
Let’s shatter the biggest myth holding manufacturers back: the idea that energy efficiency projects take a decade to pay for themselves.
The modern reality is a rapid payback of just 18–20 months. In fact, a full 70% of industrial facilities report an ROI of over 10% on their efficiency investments. The proof is in the numbers:
- One manufacturer implemented waste heat recovery and saw a payback in 17-21 months with an ROI of over 56%.
- Another facility invested a modest ₹16,30,000 (approx. $20,000 USD) and saved 95,152 kWh annually, offsetting the entire investment in just 21 months.
At scale, the returns are undeniable. A $14 billion public investment in this area generated over $624 billion in economic benefits—a 44x return that proves this is one of the smartest investments a business can make today.
Objection #1: How Do We Fund This?
You don’t have to bankroll this transformation alone. A wealth of incentives exists to accelerate your journey:
- Government Grants: Programs from bodies like the Office of Energy Efficiency and Renewable Energy (EERE) provide competitive funding.
- Loan Programs: Initiatives like the Energy Efficiency and Conservation Loan Program offer accessible financing for industrial consumers.
- Tax Incentives: In the US, Section 48C offers tax credits of up to 30% for advanced manufacturing projects. Similar incentives are available globally.
Objection #2: Will This Disrupt Our Operations?
No. This isn’t about ripping and replacing your infrastructure. Modern energy management systems are designed for seamless integration. They work with your existing SCADA systems and ERP platforms through smart, “brownfield” deployments.
IoT sensors and AI-driven analytics create a layer of intelligence on top of the systems you already trust, turning your existing infrastructure into a high-performance asset.
The Final Reality: Act Now or Get Left Behind
The industrial power monitoring market is set to double, reaching $16.9 billion by 2035. This is a fundamental shift in how manufacturing is done.
Your competitors who act now are capturing the biggest savings. They are using that reclaimed cash to fund innovation, lower their prices, and expand their capacity. Every day you wait, you are not just losing money to energy waste, you are losing ground to them.
Energy costs are climbing. Carbon reporting is becoming mandatory. The choice is no longer if, but when.
The question is simple: will you continue to let profit silently bleed out of your facility, or will you take control and reclaim it?
Your journey from energy waste to financial strength starts with a single step. Stop the heist in your factory and start reinvesting that capital into what matters: your growth, your people, and your future.
Ready to see what maximizing your savings looks like?
Sign up with CarbonMinus today and make energy data management your greatest competitive advantage.
Your New Mandate: Stop Managing Bills, Start Managing Data
The $3.2 billion manufacturing energy crisis offers two paths.
The first is the path of yesterday: continue treating energy as an uncontrollable expense. Continue paying the bill every month, writing off the 40% waste as “the cost of doing business,” and hoping your competitors are doing the same.
The second is the path of tomorrow. It starts with a simple but profound shift in mindset: stop managing your energy bills and start energy data management.
This is the central lesson from this entire guide. The “heist” in your factory is happening because of a lack of data. The “4X breakthrough” is possible only through data. The roadmap to competitive advantage is paved with data.
When you manage data, you transform an unpredictable cost into a controllable asset. You turn waste into wealth, and you build a strategic advantage that is impossible for your competitors to ignore.
The technology exists. The ROI is proven. The choice is yours.
Will you continue to be a bill-payer, or will you become a data-driven leader?
Ready to make the switch?
Sign up with CarbonMinus today and turn energy data management into cost savings.
FAQs
How much can manufacturers realistically save through energy efficiency measures?
Manufacturing plants typically waste 40% of their energy consumption. Real-time energy monitoring systems can reduce costs by 8-25%, while comprehensive efficiency programs often achieve 20-30% reductions without significant capital investment.
What’s the typical payback period for energy efficiency investments in manufacturing?
The average ROI for industrial energy monitoring systems and efficiency measures is 18-20 months, much shorter than the 5-10 years most manufacturers assume. About 70% of facilities report ROI above 10% for efficiency measures implemented over five years.
Can energy monitoring systems be implemented without disrupting production?
Yes, modern energy monitoring systems integrate with existing SCADA and ERP platforms through brownfield deployments. Phased implementation approaches manage initial costs while leveraging previous infrastructure investments.
How do I calculate the ROI for my specific facility?
Use the CarbonMinus ROI calculator at https://roi.carbonminus.com/ to get a personalized assessment. Input your industry and annual energy spend to see your specific savings opportunity and payback timeline.
What are the biggest energy waste sources in manufacturing?
Process heating waste (17% of total energy), compressed air leaks (25% of compressor output), always-on power (23% of electric bills), inefficient lighting (15%), and motor inefficiencies (20%) represent the largest waste categories.
References
- https://carbonminus.com/why-most-manufacturing-plants-waste-energy-and-how-to-fix-it/
- https://carbonminus.com/energy-management-in-manufacturing-costs-roi/
- https://carbonminus.com/hidden-cost-of-energy-waste-manufacturing-guide/
- https://carbonminus.com/remain-compliant/
- https://carbonminus.com/waste-heat-recovery-industrial-energy-efficiency/
- https://carbonminus.com/reduce-operational-cost-with-energy-management-solutions/
- https://carbonminus.com/power-of-data-in-sustainability-and-resource-management/
- https://www.epa.gov/trinationalanalysis/manufacturing-waste-management-trend
- https://www.linkedin.com/pulse/untold-roi-energy-efficiency-industrial-sector-afaq-alqimam-company-kbi4f
- https://www.azo-inc.com/blog/compressed-air-leaks
- https://mnre.gov.in/en/physical-progress/
- https://enob.eu/energy-efficiency-investment-evaluation-spbt-and-roi/
- https://www.atlascopco.com/en-in/compressors/compressed-air-audit/air-leak-check
- https://sensoneo.com/global-waste-index/
- https://blog.isa.org/why-does-industry-4.0-roi-rely-on-energy-efficiency
- https://www.cs-instruments.com/applications/leak-detection/the-invisible-costs-of-compressed-air-leaks/
- https://unstats.un.org/unsd/energystats/pubs/documents/2025pb-web.pdf
- https://www.fluke.com/en-in/learn/blog/energy-efficiency/identify-energy-savings
- https://www.compressedairchallenge.org/data/sites/1/media/library/factsheets/factsheet07.pdf
- https://www.solenis.com/en/resources/blog/how-much-do-compressed-air-leaks-cost-in-energy-and-production/
- https://carbonminus.com/guide-for-energy-management-in-indian-enterprises/
- https://carbonminus.com/reduce-emissions-with-effective-carbon-management-systems/
- https://carbonminus.com/clean-energy-adoption-esg-success/
- https://carbonminus.com/how-industrial-energy-monitoring-systems-cut-manufacturing-costs/
- https://carbonminus.com/energy-management-systems-for-environmental-sustainability/
- https://carbonminus.com/why-smart-factories-switch-to-predictive-maintenance-in-2025/
- https://carbonminus.com/how-iot-and-ai-revolutionize-energy-management/
- https://www.futurefirstenergy.com/the-power-of-payback-assessing-roi-with-the-payback-period-method-for-energy-efficiency-upgrades/
- https://www.scholarsresearchlibrary.com/articles/energy-audit-and-management-case-studies-of-diesel-engine–manufacturing-industry.pdf
- https://www.saveenergynb.ca/en/education-and-tips/energy-efficiency-articles/how-to-calculate-roi-payback-for-your-energy-efficiency-projects/
- https://www.futuremarketinsights.com/reports/industrial-power-monitoring-system-market
- https://leap4sme.eu/wp-content/uploads/2023/04/Analysis-of-energy-audits-results-and-impacts-case-of-small-and-medium-enterprises-in-Lithuania.pdf
- https://www.cognitivemarketresearch.com/energy-management-systems-market-report
- https://www.ijert.org/research/energy-audit-case-study-of-a-flex-manufacturing-company-IJERTV4IS031013.pdf
- https://www.investopedia.com/terms/p/paybackperiod.asp
- https://tech-stack.com/blog/real-time-monitoring/

