TL;DR
- On January 1, 2026 the EU Carbon Border Adjustment Mechanism (CBAM) transforms from voluntary reporting to mandatory carbon cost imposition.
- Indian foundries exporting steel, aluminum, and iron castings to Europe will pay carbon adjustment costs based on emissions intensity.
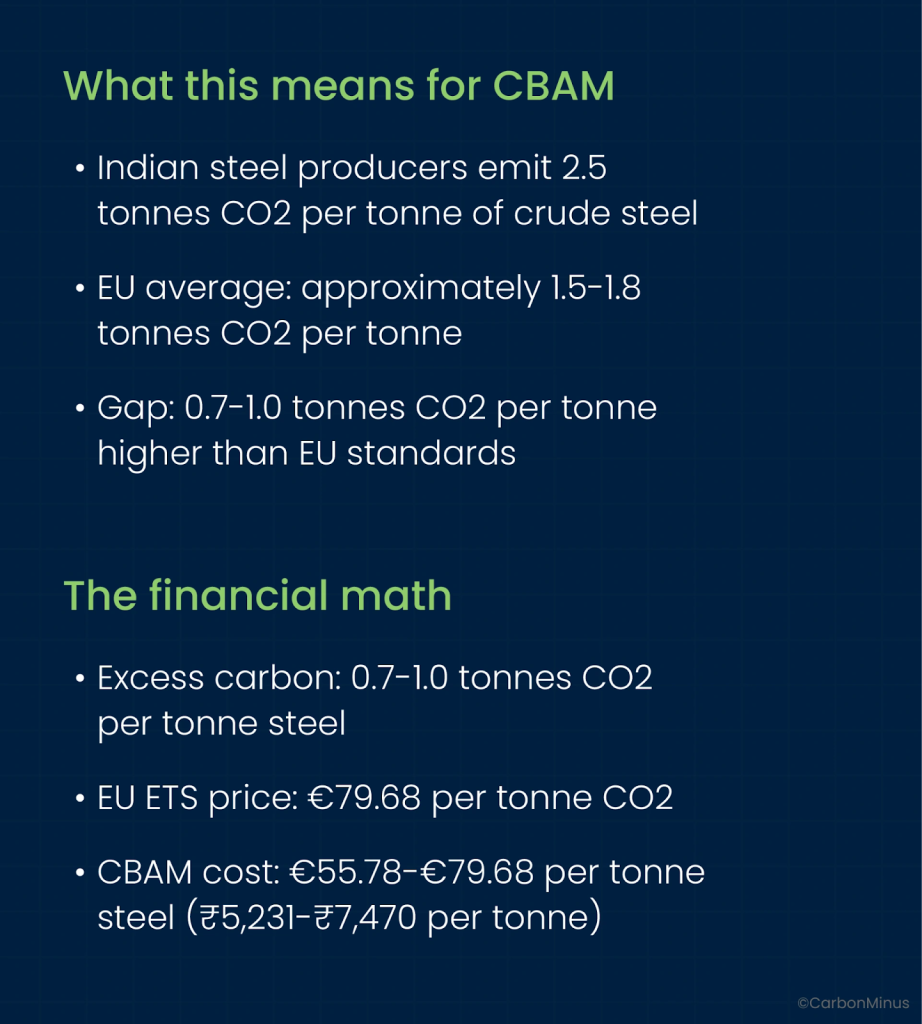
- India’s steel sector emits 2.5 tonnes CO2 per tonne (Government of India official data), approximately 0.7-1.0 tonnes higher than EU averages.
- At current EU ETS prices (€79.68/tonne CO2), this equals €55.78-€79.68 additional cost per tonne of steel exported (₹5,231-₹7,470).
- Indian steel exports to EU already declined 31.4% year-over-year (January-August 2025 vs 2024)
- Foundries lose 20-30% of compressed air system output to leaks, a medium foundry wastes 558,000 kWh annually
- Traditional centralized approaches (sequential energy audits → project approvals → implementation) require 16-24 months
- Distributed intelligence systems (real-time IoT monitoring + automated emissions tracking + predictive optimization) enable simultaneous action across multiple systems
When Inky the Octopus Taught Us About Distributed Intelligence
April 2016. National Aquarium of New Zealand, Napier.
A common octopus named Inky squeezed through a small gap at the top of his tank, barely three inches wide, left open by maintenance workers.
He dropped to the floor. Left wet tracks across the room. Found a 164-foot drainpipe leading to the ocean.
And disappeared forever.
The aquarium staff arrived the next morning to find an empty tank and a wet trail documenting his escape route. Inky had executed a jailbreak so precise that it required assessing the gap size, evaluating the floor distance, locating the drainpipe opening, and navigating 50 meters of complete darkness to freedom.
“He managed to make his way to one of the drain holes that go back to the ocean, and off he went. Didn’t even leave us a message”
— Rob Yarrell, the aquarium’s manager, told reporters.
Your foundry faces the same challenge Inky faced in that tank: a complex problem requiring coordinated action across multiple systems.
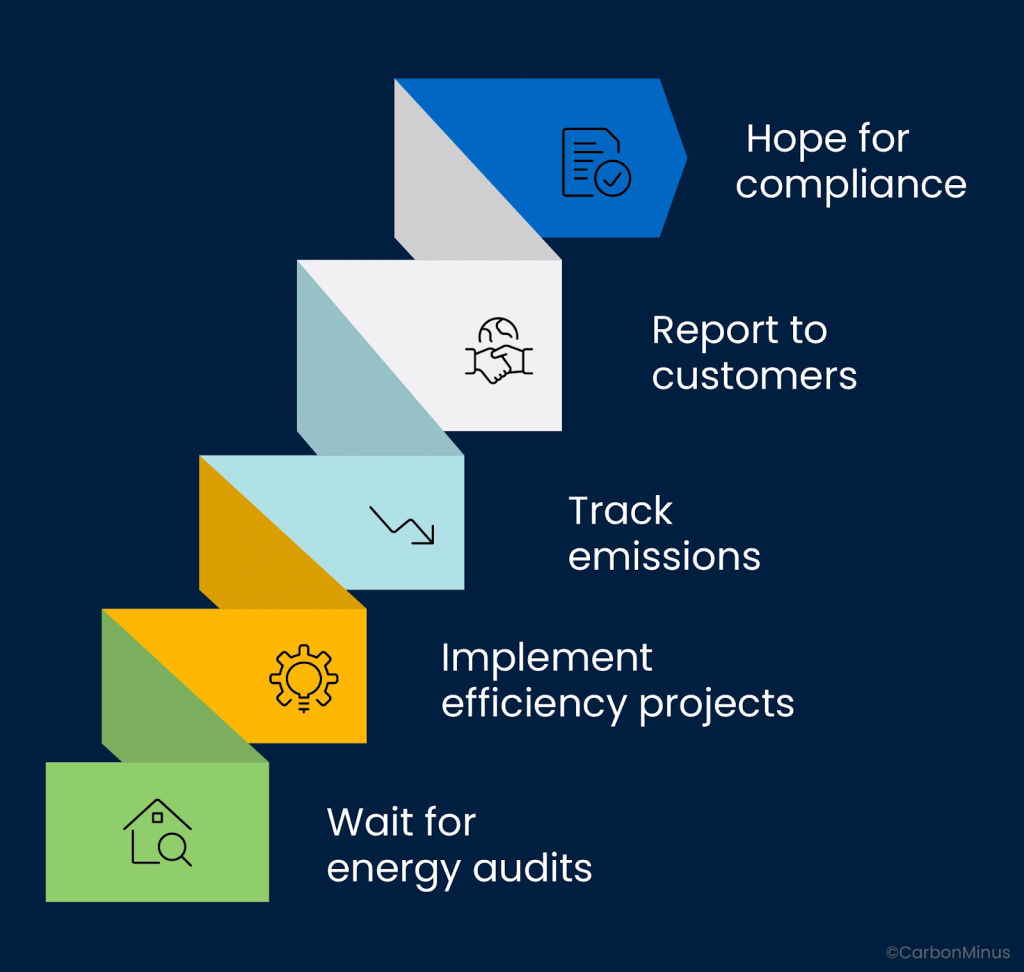
But unlike Inky’s successful escape, most Indian foundries are approaching the Carbon Border Adjustment Mechanism (CBAM) with centralized, sequential thinking:
By the time that sequence completes, it’s January 1, 2026, and you’re paying carbon costs on every shipment to Europe.
Today is October 14, 2025. You have exactly 79 days until CBAM enters full implementation.
The EU’s Carbon Border Adjustment Mechanism transforms from voluntary reporting to mandatory carbon cost imposition on January 1, 2026.
Indian foundries exporting steel, aluminum, and iron castings to Europe will face carbon adjustment costs that could eliminate profit margins entirely—or they can deploy distributed intelligence systems that optimize energy, emissions, and compliance simultaneously.
This blog explains why the octopus approach: distributed, parallel, intelligent action is the only way Indian foundries survive CBAM.
The January 1, 2026 Reality: What Actually Happens
Let’s be precise about what changes on New Year’s Day.
Before January 1, 2026: Reporting Phase
From October 2023 through December 31, 2025, CBAM operates in a “transitional phase”.
What this means:
- Importers must submit quarterly reports on embedded emissions in products
- No financial payments required yet
- Opportunity to build reporting systems and gather emissions data
- Grace period to understand compliance requirements
The reality: Most Indian foundries used this time to… wait. Hope. Assume someone else would solve it.
After January 1, 2026: Full Implementation
Starting January 1, 2026, CBAM certificates become mandatory.
What this means
- EU importers must purchase CBAM certificates to cover embedded emissions in every shipment
- Certificate prices tied directly to EU Emissions Trading System (ETS) weekly average
- Current EU ETS price: €79.68 per tonne CO2 (October 10, 2025)
- Products without accurate emissions data face default carbon intensity values that are significantly higher than actual emissions
The financial impact: A shipment with 100 tonnes of embedded CO2 at €79.68/tonne = €7,968 additional cost (approximately ₹7.47 lakh) per shipment.
India’s Carbon Intensity Problem: The Numbers Don’t Lie
Let’s establish the baseline with official government data.
India’s Steel Sector Carbon Intensity
According to the Government of India’s Press Information Bureau, India has made significant progress but still faces challenges.
CO2 emission intensity of the Indian steel sector has been reduced from around 3.1 tonnes of CO2 per tonne of crude steel in 2005 to around 2.5 tonnes of CO2 per tonne of crude steel in 2022.
— Ministry of Steel, Government of India
The Export Impact
Recent data shows Indian exporters are already feeling the pressure.
Steel exports to EU declined 35.1% in FY25 before CBAM even started charging costs.
India’s steel and aluminium exports to the EU fell 24.4 per cent in FY 2025 as CBAM reporting began and most firms struggled with compliance, according to the Global Trade Research Initiative.
Why the decline?
- Complexity of emissions reporting deterring smaller exporters
- Uncertainty about compliance requirements
- Fear of default carbon values making products uncompetitive
- EU simultaneously cutting steel import quotas by 47%
The Market Reality: India’s EU Export Exposure
Volume and Value at Risk
According to trade data:
India exported 3.71 million tonnes of steel to the EU in 2024, representing a significant portion of total exports of 8.24 million tonnes.
The EU market accounts for 45% of Indian steel exports in 2024.
Already, India’s steel and aluminium exports to the EU fell 24 per cent in FY 2025 as CBAM reporting began and most firms struggled with compliance. Once the new safeguard regime replaces the current one in June 2026, the EU market will effectively be semi-closed.
— Ajay Srivastava, founder of Global Trade Research Initiative.
The Carbon Price Gap Problem
Even with India’s recently launched Carbon Credit Trading Scheme (CCTS), the price differential remains enormous highlighting how carbon credits continue to vary widely in value depending on project type, verification standards, and market maturity.
India’s carbon price: Projected to remain below $10 per tonne CO2
EU ETS price: Currently €79.68 per tonne CO2 (approximately $87 per tonne)
The gap: Approximately $77 per tonne CO2 difference
This has been presented as a concession to India. But it is not a concession; Article 9 of the CBAM Regulation already allows such deductions for all countries. Even with India’s Carbon Credit Trading Scheme (CCTS), projected carbon prices will remain below USD 10/tCO₂. Well below the EU ETS benchmark.
— Ajay Srivastava of GTRI.
Why Centralized Problem-Solving Fails for CBAM
Most Indian foundries are approaching CBAM like this:
Step 1: Wait for annual energy audit (3-4 months)
Step 2: Review audit findings and prioritize projects (2 months)
Step 3: Budget approval process (2-3 months)
Step 4: Implement energy efficiency projects (6-12 months)
Step 5: Measure results and calculate emissions reductions (3 months)
Step 6: Report to customers and CBAM authorities (ongoing)
Total timeline: 16-24 months
Problem: CBAM starts charging costs in 79 days.
This sequential, centralized approach—where each step waits for the previous one to complete—is fundamentally incompatible with CBAM’s January 1, 2026 deadline.
The Three Failures of Centralized Approaches
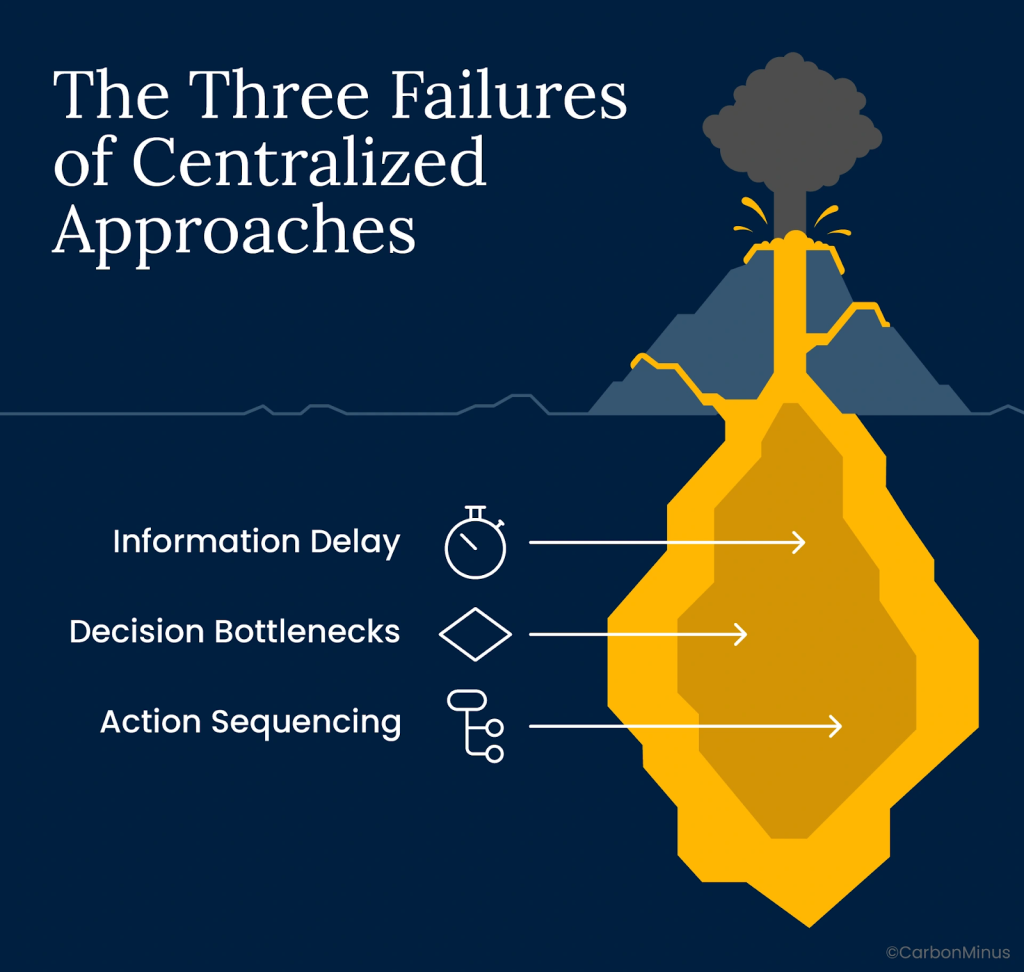
Failure #1: Information Delay
Traditional energy audits provide annual or quarterly snapshots.
By the time you identify a compressed air leak costing ₹5 lakh annually, it’s already cost ₹1.5 lakh in the three months since the problem developed.
Failure #2: Decision Bottlenecks
Every energy efficiency decision flows through: Engineering → Operations → Finance → Executive Approval.
A compressed air leak fix requiring ₹50,000 investment might take 6-8 weeks for approval while bleeding ₹40,000+ monthly in waste.
Failure #3: Action Sequencing
Projects implemented one at a time: fix compressed air leaks → optimize furnace operations → improve lighting → upgrade motors.
Each project waits for previous completion, stretching timelines and delaying carbon intensity improvements needed for CBAM compliance.
The Distributed Intelligence Solution: Learn from Inky
Remember how Inky escaped:
Each arm made independent decisions while coordinating toward a single goal.
- One arm explored the tank opening
- Another arm assessed floor distance
- A third arm located the drainpipe
- Others monitored for threats and maintained balance
All simultaneously. All coordinated. All contributing to escape.
Foundry CBAM Survival Requires the Same Architecture
System 1: Real-Time Energy Monitoring (Like Inky’s Arms Sensing Environment)
Deploy IoT sensors tracking
- Compressed air consumption and leak detection
- Furnace energy efficiency and temperature optimization
- Motor loads and power factor correction
- Overall facility energy intensity
Why it works: Problems identified within hours, not months. A compressed air leak developing at 9 AM is flagged by 10 AM, enabling same-day repair scheduling.
System 2: Automated Emissions Calculation (Like Inky’s Central Brain Coordinating)
Connect energy data directly to emissions accounting
- Real-time Scope 1 and Scope 2 calculations
- Product-level carbon intensity tracking
- Batch-by-batch emissions verification
- CBAM-ready reporting automatically generated
Why it works: No manual data collection. No spreadsheet errors. No reporting delays. Emissions calculated automatically as production occurs.
System 3: Predictive Maintenance Optimization (Like Inky’s Arms Acting Independently)
AI-driven systems that
- Predict equipment failures before they waste energy
- Optimize maintenance schedules for maximum efficiency
- Prevent compressed air system deterioration
- Maintain peak furnace performance
Why it works: Each system improves independently while contributing to overall carbon intensity reduction. No waiting for centralized approval, maintenance teams act on alerts immediately.
System 4: Supply Chain Carbon Tracking (Like Inky’s Arms Sharing Information)
Monitor embedded carbon in
- Raw material sourcing decisions
- Scrap metal vs. virgin material choices
- Transportation and logistics optimization
- Supplier carbon intensity benchmarking
Why it works: Purchasing decisions incorporate carbon costs in real-time, automatically favoring low-carbon suppliers and materials.
The Compressed Air Problem: India’s Biggest CBAM Quick Win
Let’s get specific about where Indian foundries can act immediately.
The Hidden Energy Drain
According to industry data, foundries commonly lose 20-30% of their compressor’s total output to air leaks.
Why this matters for CBAM:
Compressed air is one of the most energy-intensive utility systems:
- Accounts for 15-25% of total foundry electricity consumption
- Typical efficiency: Only 10-15% of electrical energy converts to useful compressed air work
- Every CFM of leaked air = continuous electricity waste
The Financial and Carbon Impact
Example: Medium-sized Indian foundry
Current state:
- Total compressed air system: 500 HP (373 kW)
- Operating hours: 6,000 hours/year (250 days × 24 hours)
- System leaks: 25% of capacity (conservative estimate)
- Wasted capacity: 125 HP (93 kW)
Energy waste calculation:
- Wasted power: 93 kW × 6,000 hours = 558,000 kWh/year
- Indian industrial electricity: ₹7/kWh average
- Annual cost: ₹39.06 lakh/year (~$47,000)
Carbon emissions:
- Indian grid intensity: 0.82 kg CO2/kWh average
- Wasted emissions: 558,000 kWh × 0.82 = 457.6 tonnes CO2/year
CBAM cost (after January 1, 2026):
- 457.6 tonnes CO2 × €79.68/tonne = €36,453 (~₹34.22 lakh)
- Total burden: ₹39.06 lakh energy + ₹34.22 lakh CBAM = ₹73.28 lakh annually
The Detection Problem
Approximately 80 percent of air leaks are not audible to the human ear
— Compressed Air and Gas Institute.
Traditional approach
- Annual leak survey by external contractor
- Finds leaks that existed for months
- Repair scheduling takes weeks due to production constraints
- New leaks develop continuously between surveys
Distributed intelligence approach
- IoT flow meters detect consumption anomalies within hours
- Ultrasonic sensors pinpoint leak locations without production shutdown
- Maintenance teams receive mobile alerts with exact locations
- Repairs scheduled same-day or next-day
The 79-Day Action Plan: What Indian Foundries Must Do Now
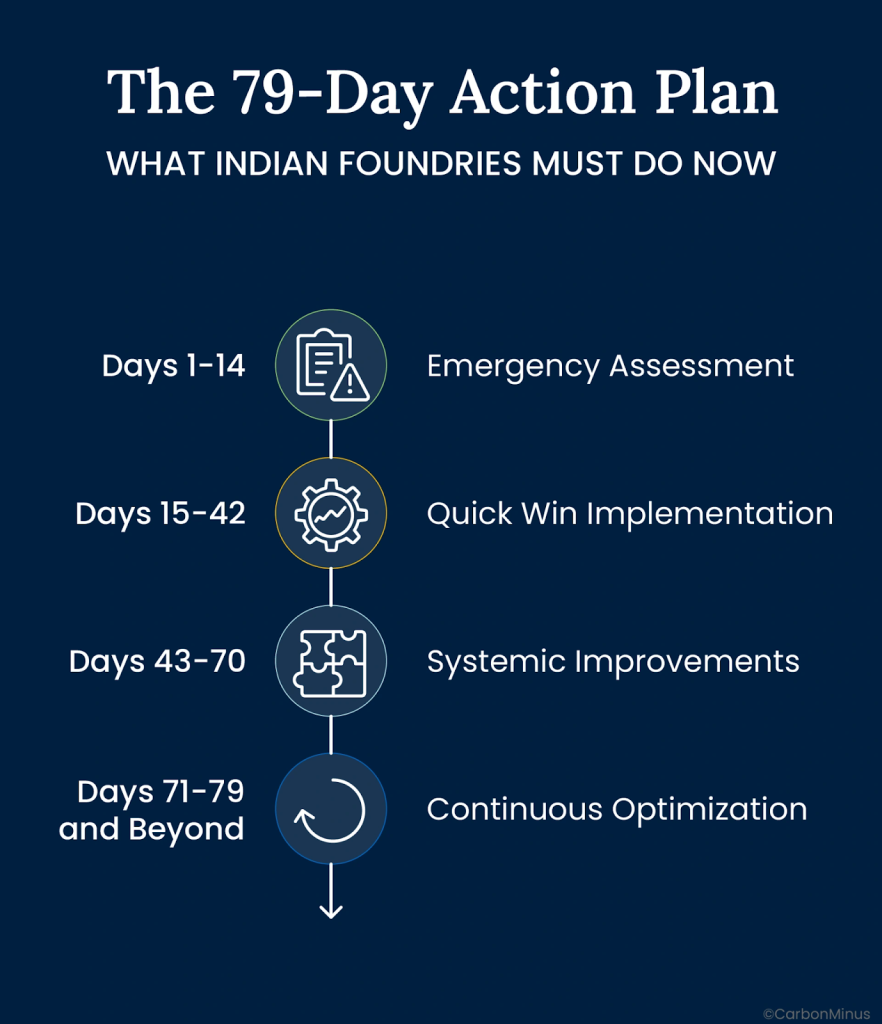
Week 1-2: Emergency Assessment (Days 1-14)
Action 1: Compressed Air System Rapid Audit
- Deploy ultrasonic leak detection immediately
- Quantify total leakage CFM and associated energy waste
- Calculate carbon emissions from compressed air losses
- Target: Identify ₹20-50 lakh annual savings opportunities
Action 2: Baseline Carbon Intensity Calculation
- Gather 12 months of energy consumption data
- Calculate Scope 1 emissions (fuel combustion in furnaces)
- Calculate Scope 2 emissions (purchased electricity)
- Establish per-tonne carbon intensity for CBAM reporting
Action 3: CBAM Exposure Quantification
- List all EU customers and monthly shipment volumes
- Calculate estimated CBAM costs per product line
- Identify which products become unprofitable under CBAM
- Prioritize carbon reduction by profit impact
Week 3-6: Quick Win Implementation (Days 15-42)
Priority 1: Compressed Air Leak Repairs
- Fix identified leaks immediately—no waiting for “planned shutdown”
- Target 50-70% leak reduction in first 30 days
- Expected savings: ₹10-35 lakh annually + 200-320 tonnes CO2
Priority 2: Furnace Optimization
- Adjust melting schedules to avoid peak electricity tariffs
- Optimize charge mix for maximum energy efficiency
- Implement temperature monitoring and control systems
- Expected improvement: 5-8% energy reduction in melting operations
Priority 3: Real-Time Monitoring Deployment
- Install IoT energy monitoring on major loads (compressed air, furnaces, motors)
- Connect to emissions calculation software
- Train operations team on dashboard usage
- Enable continuous carbon intensity tracking
Week 7-10: Systemic Improvements (Days 43-70)
Action 1: Predictive Maintenance Systems
- Deploy AI analytics on energy and equipment data
- Identify degrading equipment before efficiency drops
- Schedule maintenance based on actual condition, not calendar
- Prevent efficiency degradation that increases carbon intensity
Action 2: Supply Chain Carbon Optimization
- Evaluate raw material suppliers by carbon intensity
- Shift toward higher scrap metal content (lower embedded carbon)
- Negotiate transportation efficiency with logistics providers
- Reduce Scope 3 emissions entering your carbon footprint
Action 3: CBAM Reporting Infrastructure
- Integrate real-time data into CBAM reporting formats
- Test submission process with transitional reporting
- Train team on EU CBAM registry and procedures
- Ensure January 1 readiness with verified data
Week 11+: Continuous Optimization (Days 71-79 and Beyond)
Post-January 1 Strategy
- Monitor weekly CBAM certificate costs (tied to EU ETS pricing)
- Adjust production scheduling based on carbon cost trends
- Continue energy efficiency improvements month-over-month
- Compete on carbon intensity as competitive differentiator
The Market Reality: Who Survives and Who Doesn’t
Let’s be direct about what’s coming.
Foundries That Will Lose EU Market Access
Profile
- Waiting for “more clarity” on CBAM requirements
- Treating carbon as sustainability team problem, not operations imperative
- Relying on annual energy audits and sequential improvement projects
- No real-time emissions tracking or verification capability
- Carbon intensity >2.5 tonnes CO2/tonne without improvement plan
Outcome after January 1, 2026
- CBAM costs eliminate profit margins on EU shipments
- EU importers shift to lower-carbon suppliers (within EU or other regions)
- Indian foundries forced to exit EU market or accept unprofitable sales
- Market share lost permanently as customers establish new supply relationships
Foundries That Will Gain Competitive Advantage
Profile
- Deployed distributed intelligence systems before December 31, 2025
- Real-time energy and emissions monitoring operational
- Carbon intensity reduced 15-25% below Indian average through rapid optimization
- CBAM-ready reporting infrastructure tested and verified
- Can prove low-carbon production to EU customers
Outcome after January 1, 2026
- CBAM costs lower than competitors due to superior carbon intensity
- EU customers prioritize proven low-carbon suppliers
- Price premium justified by lower carbon adjustment costs
- Market share gains as higher-carbon competitors exit
The CarbonMinus Distributed Intelligence Platform
This is where technology becomes strategically decisive.
Why Manual Approaches Fail CBAM Compliance
Problem 1: Data Gaps
Traditional systems can’t provide product-level, batch-level carbon intensity required for CBAM.
Problem 2: Time Lag
Monthly or quarterly emissions calculations miss real-time optimization opportunities.
Problem 3: Verification Complexity
EU authorities require “auditable, primary data tied to actual production”—not estimates or annual averages.
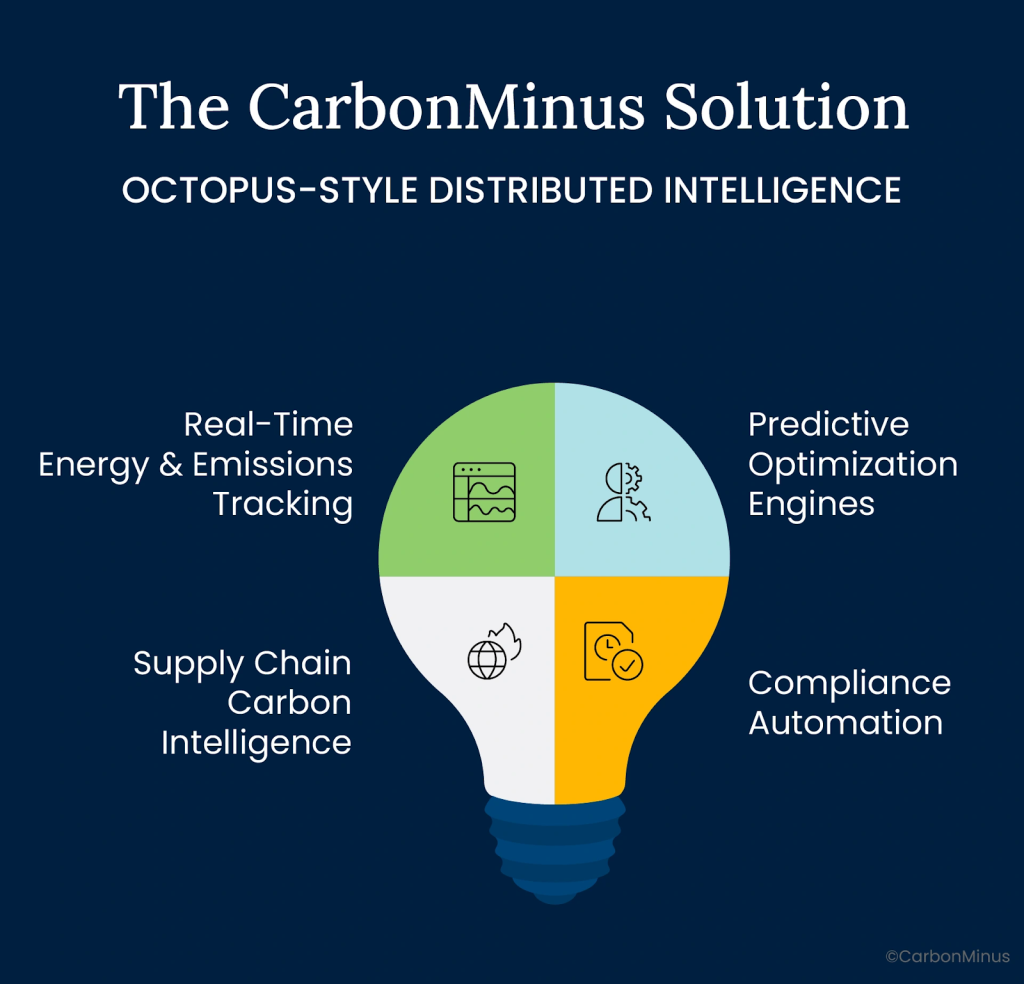
The CarbonMinus Solution: Octopus-Style Distributed Intelligence
Real-Time Energy & Emissions Tracking
- IoT sensors on all major energy-consuming equipment
- Automatic Scope 1 and Scope 2 emissions calculation
- Product-level carbon intensity by batch, shift, and production line
- CBAM-ready reporting generated automatically
Predictive Optimization Engines
- AI identifying energy waste patterns before they become problems
- Compressed air leak detection within hours of development
- Furnace efficiency degradation alerts triggering maintenance
- Continuous improvement without waiting for audits
Supply Chain Carbon Intelligence
- Raw material carbon intensity tracking and supplier benchmarking
- Scrap vs. virgin material optimization for lowest embedded carbon
- Transportation route optimization for Scope 3 reduction
- Total value chain visibility for CBAM compliance
Compliance Automation
- EU CBAM reporting formats auto-populated from live production data
- Verification audit trails maintained automatically
- Default value avoidance through accurate primary data
- January 1, 2026 ready with zero manual data entry
The Intelligence to Escape
Inky the octopus didn’t escape because he was stronger than his captors.
He escaped because he had distributed intelligence that could solve complex problems faster than centralized decision-making.
When aquarium staff discovered the empty tank, they were shocked—not because escape was impossible, but because they never imagined an octopus could coordinate such a complex operation.
Your EU customers are about to have the same realization about Indian foundries.
Most will assume CBAM makes Indian steel uncompetitive. That the carbon intensity gap is insurmountable. That 79 days isn’t enough time to transform operations.
They’re wrong.
The foundries deploying distributed intelligence systems before January 1, 2026 will prove that carbon intensity is a choice, not a destiny.
Real-time monitoring isn’t optional anymore. It’s not a “nice-to-have” for sustainability reports. It’s the difference between participating in the EU market and being permanently shut out.
Every hour of compressed air leaks you ignore is hours of carbon intensity you’re locking into your production baseline.
Every day without real-time emissions tracking is another day you can’t prove your carbon performance to EU importers.
Every week without optimization systems is another week competitors are gaining carbon advantages you’ll never recover.
Inky squeezed through a three-inch gap and traveled 164 feet through darkness to freedom.
Your foundry’s freedom from CBAM costs requires the same boldness.
The gap is open. The path exists. The intelligence systems are available.
The only question: Will you wait for permission, or will you escape?
About CarbonMinus
CarbonMinus transforms manufacturing supply chain complexity into competitive advantage. Our supplier engagement platform integrates with existing procurement systems to deliver real-time Scope 3 monitoring and automated regulatory compliance. We help manufacturers build supplier partnerships that simultaneously reduce emissions, cut costs, and create strategic moats, turning operational excellence into measurable business value.
Learn more at carbonminus.com
FAQs
What exactly changes on January 1, 2026?
CBAM transitions from transitional reporting (October 2023-December 31, 2025) to full implementation requiring mandatory CBAM certificate purchases. Before January 1, 2026, EU importers only submit quarterly emissions reports with no financial payments. After January 1, 2026, importers must purchase CBAM certificates covering embedded CO2 in every shipment, with prices tied to EU ETS weekly average (currently €79.68/tonne CO2). Products without accurate emissions data face default carbon intensity values significantly higher than actual emissions, making them uncompetitive.
How much will CBAM cost Indian foundries per tonne of steel exported?
India’s steel sector carbon intensity is 2.5 tonnes CO2 per tonne crude steel (Government of India official data). EU average is approximately 1.5-1.8 tonnes CO2/tonne, creating a gap of 0.7-1.0 tonnes CO2/tonne. At current EU ETS price of €79.68/tonne CO2, CBAM costs equal €55.78-€79.68 per tonne steel exported (₹5,231-₹7,470). For a 1,000-tonne monthly shipment, this equals €55,780-€79,680 (₹52.31-₹74.70 lakh) additional cost per month. Products with higher carbon intensity or those using default values face even higher costs.
Is the EU actually blocking Indian steel, or is this just compliance paperwork?
The market is already semi-closed before CBAM even starts charging costs. Indian steel exports to EU declined 31.4% year-over-year (January-August 2025 vs 2024). Total steel and aluminum exports dropped 24.4% as firms struggled with compliance reporting. The EU simultaneously cut steel import quotas from India by 47% and doubled tariffs. “Once the new safeguard regime replaces the current one in June 2026, the EU market will effectively be semi-closed,” warned Ajay Srivastava of Global Trade Research Initiative.
How does India’s steel carbon intensity compare to global standards?
India reduced steel sector CO2 emissions from 3.1 tonnes per tonne crude steel (2005) to 2.5 tonnes per tonne (2022), significant progress but still above EU averages of 1.5-1.8 tonnes per tonne. This 0.7-1.0 tonne gap translates directly to CBAM costs of €55.78-€79.68 per tonne at current carbon prices. Indian foundries using coal-based power and older production technologies face even higher intensities. The Government of India is promoting decarbonization through energy efficiency improvements, renewable energy adoption, and increased scrap utilization.
Will India’s Carbon Credit Trading Scheme (CCTS) help with CBAM costs?
CCTS provides minimal CBAM relief due to price differential. India’s carbon prices are projected below $10/tonne CO2, while EU ETS trades at €79.68 (~$87/tonne)—an $77/tonne gap. CBAM allows deduction for carbon prices paid domestically, but “even with India’s Carbon Credit Trading Scheme (CCTS), projected carbon prices will remain below USD 10/tCO₂, well below the EU ETS benchmark,” explained GTRI founder Ajay Srivastava. The real solution is reducing carbon intensity through energy efficiency and process optimization, not relying on carbon credit price offsets.
Why focus on compressed air when furnaces use more energy?
Compressed air offers the fastest ROI for CBAM compliance. Foundries lose 20-30% of compressor output to leaks—wasted energy that’s invisible yet continuous. A medium foundry’s compressed air leaks waste 558,000 kWh annually (₹39.06 lakh energy cost + ₹34.22 lakh CBAM cost = ₹73.28 lakh total burden). Detection and repair can be completed in 30-45 days with minimal capital investment. “Approximately 80 percent of air leaks are not audible to the human ear,” meaning traditional approaches miss the majority of waste. IoT monitoring detects leaks within hours, enabling immediate repair before waste accumulates.
Can we really achieve meaningful carbon reduction in 79 days?
Yes, through distributed intelligence targeting quick wins. Compressed air leak repairs alone reduce carbon intensity 10-15% within 30-45 days for typical foundries. Furnace optimization (melting schedule adjustments, temperature control) adds 5-8% reduction with minimal capital. Combined with real-time monitoring preventing new waste, foundries achieve 15-25% total carbon intensity reduction in first 60-90 days. This doesn’t require new equipment—it’s optimizing existing systems through better visibility and control. Sequential approaches (energy audit → approval → implementation) take 16-24 months; distributed systems act simultaneously across all opportunities.
What is “distributed intelligence” and why does it matter for CBAM?
Distributed intelligence means multiple systems making independent decisions while coordinating toward a single goal—like the octopus that escaped New Zealand aquarium by having each arm independently solve problems (assess gap, measure distance, locate drainpipe) while coordinating escape. For foundries, this means: IoT sensors detecting compressed air leaks immediately (not waiting for annual audits), predictive systems optimizing furnace efficiency continuously (not quarterly reviews), automated emissions calculations updating in real-time (not monthly spreadsheets), and maintenance teams acting on alerts same-day (not waiting for centralized approval). Traditional centralized approaches bottleneck through sequential decision-making, too slow for 79-day CBAM deadline.
What’s the 79-day action plan priority sequence?
Week 1-2 (Days 1-14): Emergency assessment—compressed air rapid audit, baseline carbon intensity calculation, CBAM exposure quantification by product line. Week 3-6 (Days 15-42): Quick win implementation—repair identified leaks (target 50-70% reduction), optimize furnace scheduling, deploy real-time IoT monitoring on major loads. Week 7-10 (Days 43-70): Systemic improvements—activate predictive maintenance systems, optimize supply chain carbon (higher scrap content), integrate CBAM reporting infrastructure. Week 11+ (Days 71-79): Verification and testing—ensure January 1 readiness, train teams on reporting procedures, establish post-CBAM continuous optimization. This parallel execution across multiple systems (not sequential) enables meaningful results before January 1, 2026.
What technology investments are required, and what’s the ROI?
Core investments: IoT energy monitoring sensors (₹8-15 lakh for medium foundry), emissions calculation software (₹5-10 lakh annual license), ultrasonic leak detection equipment (₹3-6 lakh), and predictive analytics platform (₹10-20 lakh implementation). Total investment: ₹26-51 lakh for comprehensive system. ROI comes from three sources: compressed air leak elimination (₹39.06 lakh annual savings for medium foundry), CBAM cost avoidance (₹34.22 lakh annual for compressed air alone), and furnace/process optimization (additional 5-8% energy reduction). Typical payback: 4-8 months. More importantly, these systems provide ongoing visibility enabling continuous optimization, not one-time fixes.
Will fixing compressed air and energy really make us competitive vs. EU and Chinese suppliers?
Carbon intensity becomes the competitive differentiator under CBAM. Indian foundries achieving 15-25% carbon intensity reduction through rapid optimization (moving from 2.5 to 1.9-2.1 tonnes CO2/tonne) reduce CBAM costs from ₹7,470/tonne to ₹4,200-₹5,600/tonne a ₹1,870-₹3,270 competitive advantage per tonne vs. non-optimized Indian competitors. EU customers will prioritize suppliers providing verified low-carbon production data because it reduces their CBAM certificate purchase costs. The market is restructuring: “India’s steel and aluminium exports to the EU fell 24.4 per cent as CBAM reporting began and most firms struggled with compliance” meaning foundries with verification systems gain share as others exit.
What happens to foundries that don’t act before January 1, 2026?
Three immediate consequences: 1) CBAM costs eliminate profit margins—products using default carbon values (significantly higher than actual emissions) become uncompetitive overnight, 2) EU importers shift orders to verified low-carbon suppliers (within EU or from competitors with real-time emissions data), 3) Lost market share becomes permanent as customers establish new supply relationships and are reluctant to switch back. The data shows this already happening: 31.4% decline in Indian steel exports to EU year-over-year before CBAM even starts charging costs. Post-January 1, the gap widens further as carbon-optimized foundries demonstrate verified low-carbon production while others remain stuck with default values or manual estimation.
Is there any chance CBAM gets delayed or India gets an exemption?
No credible possibility of delay or broad exemption. The EU published official documentation confirming “The CBAM definitive period will start on 1st January 2026”. India’s carbon pricing under CCTS does provide deductions under CBAM Article 9, but this only reduces costs by ~$10/tonne (India’s carbon price) while EU ETS is $87/tonne, leaving a $77/tonne gap that must be paid. “This has been presented as a concession to India. But it is not a concession; Article 9 of the CBAM Regulation already allows such deductions for all countries,” explained Ajay Srivastava of GTRI. The only viable strategy is reducing carbon intensity to minimize CBAM costs.
How does CarbonMinus enable 79-day CBAM compliance?
CarbonMinus deploys distributed intelligence systems that act simultaneously rather than sequentially. Real-time IoT monitoring identifies compressed air leaks, furnace inefficiencies, and motor waste within hours (not months). Automated emissions calculation tracks Scope 1 and Scope 2 at product-level, batch-level, and shift-level—providing CBAM-ready reporting without manual data collection. Predictive optimization prevents new waste from developing between traditional audit cycles. Integration with EU CBAM reporting formats auto-populates required data from live production systems. This parallel optimization across compressed air, furnaces, motors, and supply chain enables 15-25% carbon intensity reduction in 60-90 days—fast enough for January 1, 2026 deadline.
What’s included in the free 79-day CBAM survival assessment?
Comprehensive analysis covering: 1) Current carbon footprint calculation (exact tonnes CO2/tonne production with gap vs EU averages and CBAM default values), 2) CBAM cost exposure quantification across all EU customers and product lines, 3) Compressed air system assessment identifying ₹20-50 lakh annual savings with 30-60 day payback, 4) Week-by-week action roadmap through December 31, 2025, 5) Technology deployment timeline (IoT sensors, monitoring systems, reporting infrastructure), 6) Post-CBAM competitive strategy positioning carbon intensity as differentiator. Assessment completed in 5-7 business days, providing board-ready business case with investment requirements, ROI projections, and implementation plan ensuring January 1, 2026 readiness.