TL;DR
- Real-time energy monitoring delivers 4x better results than annual audits: 20% savings vs. 5%
- Average savings for large US manufacturers: $420K+ annually with 6-11 month payback periods
- Manufacturing facilities waste 20-30% of energy through compressed air leaks, phantom loads, and equipment inefficiencies
- IoT sensors + AI analytics identify problems instantly, enabling immediate corrections traditional audits miss for months
- Case studies prove results: Steel plants save 648,000 kWh annually, chemical facilities save ₹93.99 lakhs ($113K USD)
- Hardware-agnostic platforms integrate with existing infrastructure—no costly equipment replacement required
- Predictive maintenance reduces costs by 25% while preventing equipment failures
- 70% of facilities report ROI above 10% within 18-20 months
- Implementation takes 90 days with minimal production disruption. Savings start within weeks
- Competitive reality: Manufacturers using real-time monitoring gain 15-20% cost advantages over competitors still relying on annual audits
In 1956, engineer Wilson Greatbatch reached into a box of electrical components, grabbed what he thought was the right resistor for his heart rhythm recorder, and plugged it in. The device immediately started pulsing, mimicking a human heartbeat perfectly. He’d grabbed the wrong resistor.
That “mistake” became the pacemaker, saving millions of lives over the next seven decades.
Here’s what makes that story fascinating: Greatbatch wasn’t looking for a medical breakthrough. He was building a completely different device. But the moment he recognized the unexpected pattern, he pivoted immediately rather than tossing aside the “failed” experiment.
Manufacturing leaders face a similar pattern-recognition moment right now with energy management. Most facilities rely on annual energy audits—the equivalent of Greatbatch building his original heart recorder. But there’s a “wrong resistor” opportunity sitting in plain sight: real-time energy monitoring dashboards that deliver 4x better results.
The difference between 5% savings (traditional audits) and 20% savings (real-time monitoring) represents over $420,000 annually for the average large manufacturing facility. And unlike Greatbatch’s accidental discovery, you don’t need luck. Just the willingness to recognize patterns your competitors are still missing.
The payback? 11 months or less for most facilities.
Let’s break down why this opportunity is hiding in plain sight—and how to capture it before your competitors do.
The Million-Dollar Blind Spot Most Manufacturers Don’t Know They Have
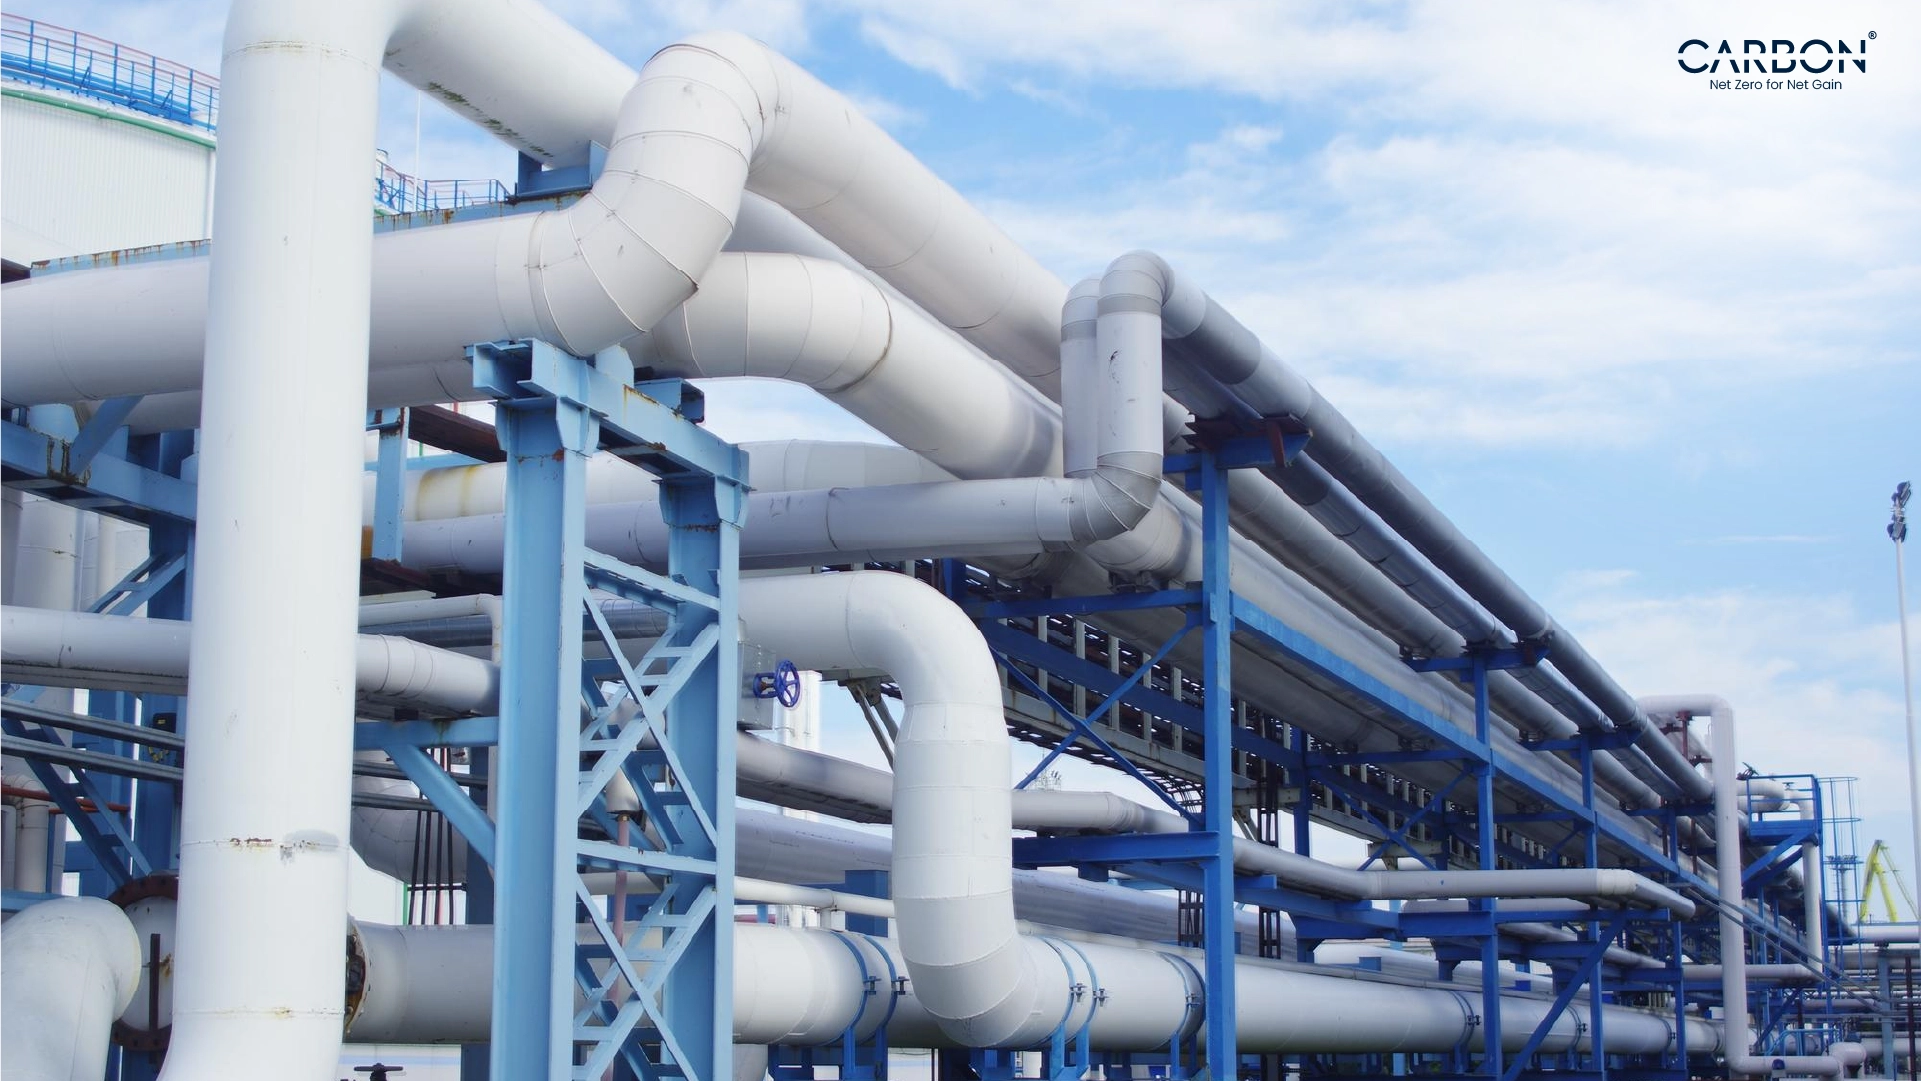
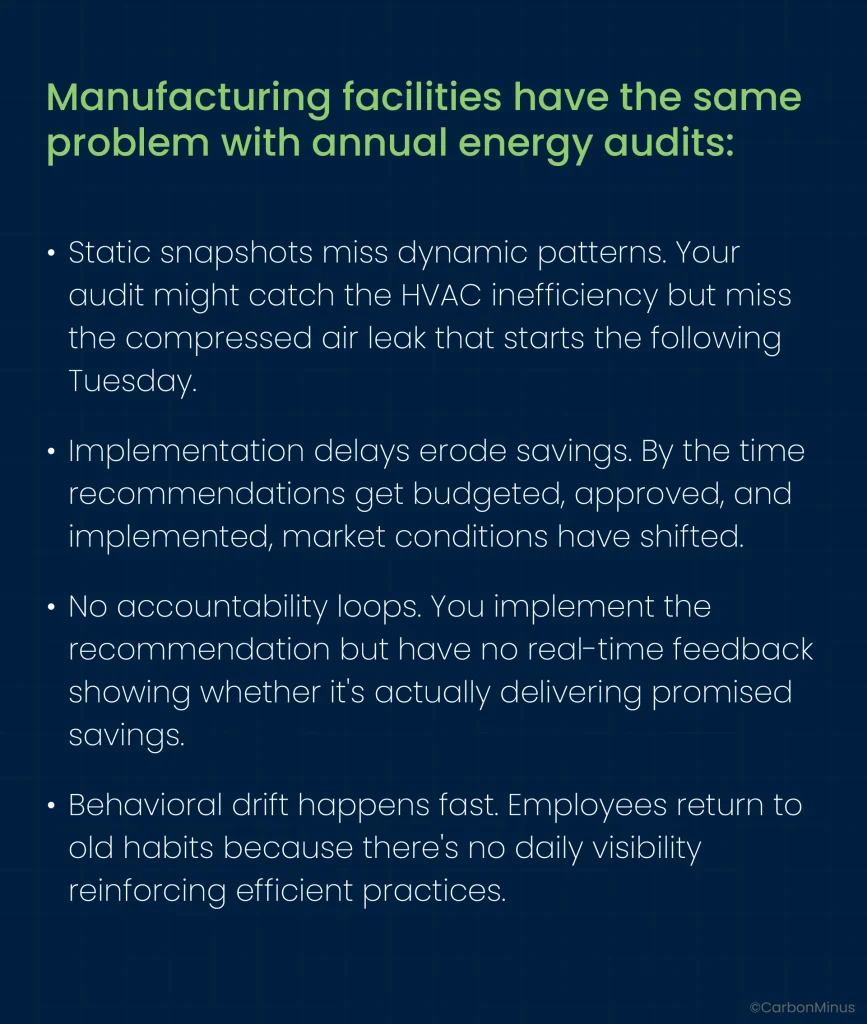
Right now, your manufacturing facility is probably wasting somewhere between 20-30% of its energy spend. Not because your team is incompetent. Not because your equipment is ancient. But because you’re managing energy the same way ship captains navigated before GPS by looking at where you’ve been, not where you’re going.
Traditional energy audits are retrospective snapshots. An energy consultant shows up once a year, walks through your facility with a clipboard, analyzes last quarter’s utility bills, and hands you a 47-page report with recommendations you’ll implement “when budget allows”.
By the time you act on those insights, they’re already outdated.
Meanwhile, your compressed air system has been leaking 30% of its output for three months. Your HVAC is running full blast while loading docks sit open. Motors are drawing power at inefficient loads because nobody knows which machines are actually running.
The average US manufacturing facility spends 15-25% of total operating costs on energy. At industrial electricity rates averaging $0.08 per kWh, that’s substantial budget leakage. For a facility with 5-10 MW demand, we’re talking $200,000-$800,000+ annually in energy costs.
Here’s the uncomfortable math: Traditional audits typically identify 5% in savings opportunities. Real-time monitoring dashboards find 20%.
That 15-percentage-point gap isn’t theoretical. It’s $420,000+ walking out your facility doors every year in the form of compressed air leaks, phantom loads, inefficient equipment cycling, and missed demand response opportunities.
The 4x Performance Gap Nobody’s Talking About
Let’s talk about why real-time dashboards deliver four times better results than traditional audits.
Traditional Audits: The 5% Reality
Energy audits operate like annual physicals at the doctor’s office. You show up once a year, get poked and prodded, receive recommendations, then leave without continuous monitoring. If you develop a health issue between visits? You won’t know until next year’s checkup.
The result? Traditional audits deliver 5% average savings and that’s if you actually implement every recommendation.
Real-Time Dashboards: The 20% Advantage
Now imagine instead of annual doctor visits, you wore a continuous health monitor tracking heart rate, sleep quality, activity levels, and nutrition in real-time. You’d spot problems immediately and adjust behavior instantly.
That’s what real-time energy dashboards do for manufacturing facilities:
Continuous monitoring captures all inefficiency patterns. IoT sensors track every piece of equipment 24/7, identifying waste the moment it starts. That compressed air leak doesn’t cost you three months of waste—it gets flagged within hours.
Immediate alerts enable instant corrections. When your boiler starts drawing excessive power at 2:47 AM, the system sends an alert to your facilities manager’s phone. Problem diagnosed and fixed before the morning shift arrives.
Predictive analytics prevent failures before they happen. AI algorithms analyze equipment performance patterns and predict failures weeks in advance, enabling preventive maintenance that reduces energy waste and avoids costly downtime.
Behavioral reinforcement drives culture change. When operators see real-time feedback showing exactly how their actions impact energy consumption, they naturally optimize behavior. It’s the difference between “close the loading dock door when you remember” and “you just cost us $47 in the last 15 minutes”.
The numbers speak for themselves: Real-time energy monitoring delivers 20% average savings. That’s four times more effective than traditional audits.
And here’s the kicker: 70% of facilities implementing real-time monitoring report ROI above 10%, with average payback periods of 18-20 months. Many achieve even faster returns.

The 11-Month Payback Math That Changes Everything
Let’s destroy the myth that energy efficiency investments require 5-10 year payback periods. That outdated assumption keeps manufacturers sitting on $420K+ in annual savings opportunities.
Here’s the actual math for real-time energy monitoring implementation:
Dashboard Implementation Costs (Typical Large Facility)
Hardware sensors and meters: $50,000-$100,000
- IoT sensors for electrical panels, motors, HVAC, compressed air
- Smart meters with cellular/LoRa connectivity
- Gateway devices for data transmission
Software platform licensing: $20,000-$50,000 annually
- Cloud-based monitoring dashboard
- AI-powered analytics engine
- Mobile app access for team members
- Automated reporting capabilities
Installation and integration: $30,000-$80,000
- Professional installation services
- Integration with existing building management systems
- Hardware-agnostic platform setup
- Team training and onboarding
Total First-Year Investment: $100,000-$230,000
That number might make some CFOs wince. But now look at the monthly returns:
Monthly Savings Breakdown (5-10 MW Manufacturing Facility)
Demand response optimization: 15-25% peak demand reduction
- Savings: $8,000-$15,000/month
- How: Load shifting, peak shaving, strategic equipment scheduling
Power factor correction: 5-10% efficiency gains
- Savings: $3,000-$6,000/month
- How: Automated capacitor bank management, reactive power optimization
Equipment optimization: 10-20% consumption reduction
- Savings: $12,000-$25,000/month
- How: Motor efficiency programs, HVAC tuning, compressed air leak detection
Preventive maintenance: 25% maintenance cost reduction
- Savings: $5,000-$10,000/month
- How: Predictive analytics preventing emergency repairs and downtime
Total Monthly Savings: $28,000-$56,000
The 11-Month Reality
Conservative scenario: $230,000 investment ÷ $28,000 monthly savings = 8.2-month payback
Aggressive scenario: $100,000 investment ÷ $56,000 monthly savings = 1.8-month payback
Typical mid-range: $165,000 investment ÷ $42,000 monthly savings = 3.9-month payback
Even in the most conservative scenario, you’re looking at payback well under a year. Most facilities hit full ROI between 6-11 months.
And remember: This isn’t a one-time savings. Once you’ve paid back the investment, those monthly savings continue stacking—$420,000+ annually, year after year.
Compare that to traditional energy audits costing $15,000-$30,000 that deliver one-time 5% savings with no ongoing monitoring. The math isn’t even close.
When a Steel Plant Saved 648,000 kWh (And Counting)
Numbers on spreadsheets are one thing. Real facilities achieving measurable results? That’s where theory becomes reality.
Case Study #1: Steel Manufacturing Transformation
A large steel production facility implemented real-time energy monitoring across their entire operation. By tracking energy usage minute by minute, they identified inefficiencies, optimized furnace schedules, and reduced idle load. This data-driven approach didn’t just improve sustainability — it also showed how real-time energy monitoring business costs can directly translate into measurable savings and higher operational profitability.
The Challenge: Rising energy costs threatening profit margins, no visibility into which processes consumed the most power, compliance pressure from environmental regulations.
The Solution: CarbonMinus deployed IoT sensors across melting furnaces, rolling mills, cooling systems, and auxiliary equipment, creating a unified dashboard with real-time visibility.
The Results:
- 648,000 kWh saved annually
- ₹68.32 lakhs ($82,000 USD) in cost savings per year
- 11.3-month payback period
- Automated ISO 50001 compliance reporting
The facility manager reported that the biggest surprise wasn’t finding one massive inefficiency—it was discovering dozens of “small” issues that added up to enormous waste. A cooling pump running overnight unnecessarily. Lighting systems operating at full capacity in empty zones. Compressed air leaks totaling 22% of compressor output.
Each individual problem seemed trivial. Together, they represented over $82,000 in annual waste.
Case Study #2: Chemical Plant’s Million-Rupee Discovery
A chemical manufacturing facility faced a similar challenge: energy costs climbing 12% year-over-year with no clear explanation.
Implementation: Real-time monitoring across reactors, distillation columns, pumping systems, and HVAC infrastructure.
The Results:
- 1,024,424 kWh saved annually
- ₹93.99 lakhs ($113,000 USD) cost reduction per year
- 9.8-month payback
- 25% reduction in maintenance costs through predictive analytics
The chemical plant’s operations director made a fascinating observation: “We thought we needed to invest in new equipment to improve efficiency. Turns out, we just needed to understand how our existing equipment was actually performing. The savings came from optimization, not replacement.”
Cross-Industry Validation
These aren’t cherry-picked outliers. A hospitality facility documented $471,891 in savings over three years using real-time energy monitoring. Manufacturing facilities across industries report 12-24 month payback periods as standard.
Research shows 82% of implementations exceed projected savings targets. When properly deployed, real-time monitoring consistently delivers measurable, auditable results.
The pattern is clear: Visibility drives optimization. Optimization drives savings. Savings drive competitive advantage.
The Dashboard Technology Advantage: Beyond Pretty Charts
Let’s be honest: “dashboard” sounds like another software buzzword that executives love and operators tolerate. But real-time energy monitoring platforms deliver capabilities that fundamentally change how manufacturing facilities operate.
Real-Time Visibility That Actually Matters
IoT Sensor Networks: Modern energy monitoring uses industrial-grade sensors continuously collecting data across electrical systems, HVAC, compressed air, process equipment, and auxiliary loads. Unlike manual meter readings taken monthly, these sensors capture consumption patterns every few seconds, creating granular visibility into exactly where energy flows.
AI-Powered Analytics: Pattern recognition algorithms analyze thousands of data points simultaneously, identifying anomalies human operators would never catch. The system learns your facility’s “normal” energy signature and flags deviations immediately—a motor drawing 15% more power than usual, HVAC cycling inefficiently during off-hours, phantom loads consuming electricity from equipment supposedly offline.
Mobile Accessibility: Plant managers access real-time insights from anywhere via smartphone apps. Receive instant alerts when energy consumption spikes. Review daily performance reports during morning coffee. Adjust equipment settings remotely when needed. The days of being chained to a desktop computer in the facilities office are over.
Predictive Maintenance Integration: Real-time monitoring tracks energy and predicts equipment failures before they happen. Unusual vibration patterns, temperature fluctuations, and power draw anomalies signal impending failures weeks in advance. This enables preventive maintenance that avoids costly emergency repairs and production downtime while reducing energy waste from degraded equipment performance.
Features That Deliver Immediate Value
Single Line Diagram (SLD) Visualization: See your entire electrical system mapped visually in real-time. Understand power flow from utility connection through distribution panels to individual loads. Identify bottlenecks, imbalances, and optimization opportunities at a glance.
Load Forecasting: AI predicts future demand patterns based on historical data, production schedules, and external factors like weather. This enables strategic load management, shifting non-critical operations to off-peak hours, optimizing equipment runtime, and avoiding expensive demand charges.
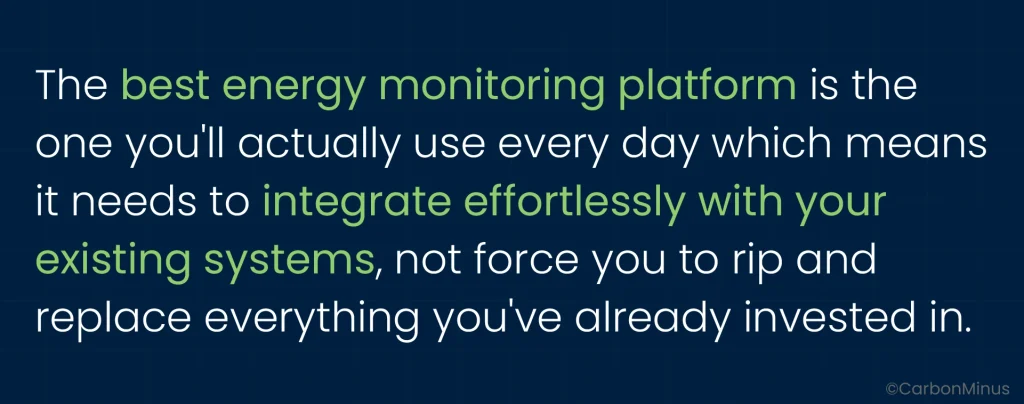
Automated Compliance Reporting: Generate ISO 50001, BRSR, and environmental regulation reports automatically. The platform maintains auditable records of energy consumption, emissions tracking, and efficiency improvements. What used to require weeks of manual data compilation now happens with a few clicks.Hardware Agnostic Integration: Unlike proprietary systems requiring complete infrastructure replacement, modern platforms work with existing equipment. Connect to legacy meters, building management systems, and new IoT sensors seamlessly. This dramatically reduces implementation costs and deployment time.
The Implementation Roadmap: From Setup to Savings in 90 Days
The fear holding many manufacturers back isn’t whether real-time monitoring works—it’s how disruptive implementation will be. Nobody wants to shut down production lines for weeks while consultants install sensors and integrate software.
Good news: Modern deployment happens in phases, minimizing disruption while delivering quick wins.
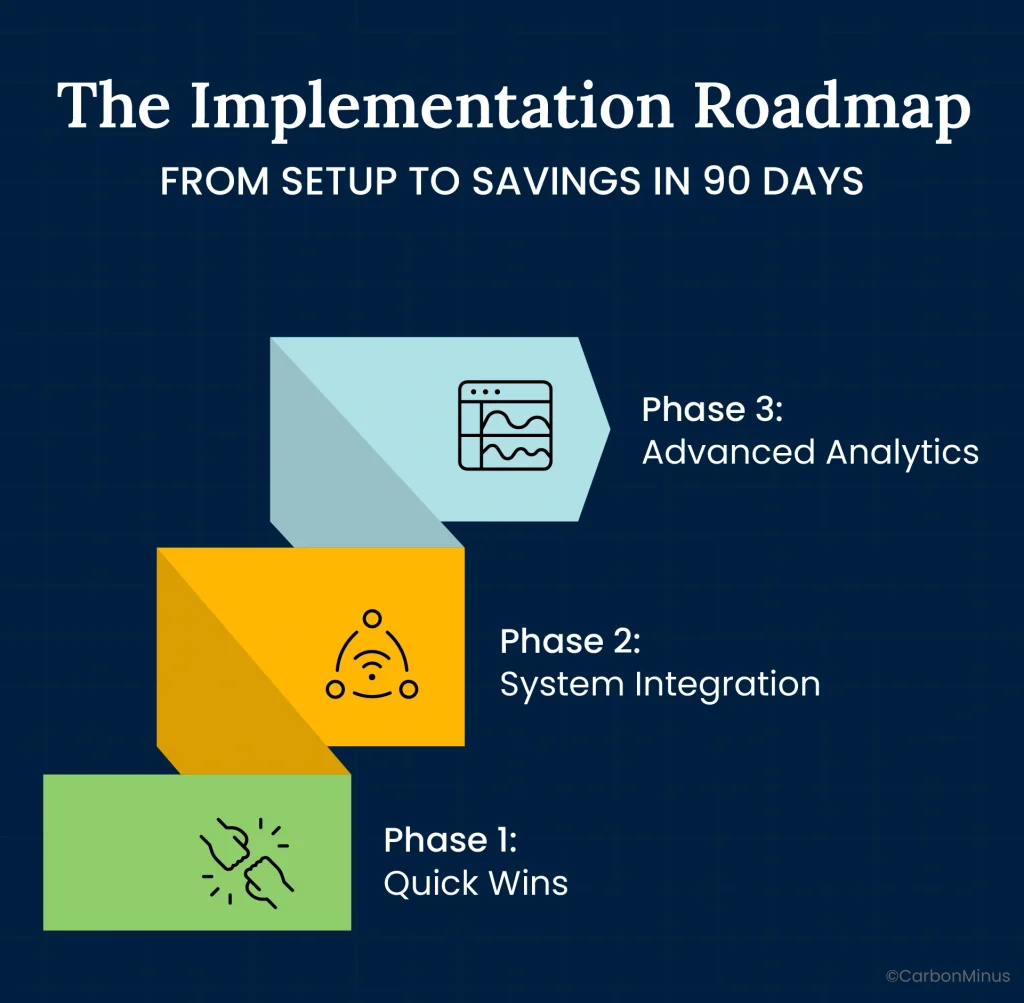
Phase 1: Quick Wins
Week 1-2: Assessment & Priority Mapping
- Identify high-consumption areas (typically compressed air, HVAC, process heating, motors)
- Map existing metering infrastructure
- Set baseline consumption metrics
Week 3-6: Sensor Deployment
- Install IoT sensors on priority equipment
- Deploy gateway devices for data transmission
- Configure initial dashboard views
Week 7-12: Immediate Optimization
- Compressed Air Leak Detection: Most facilities discover leaks wasting 20-30% of compressor output. Fixing leaks requires minimal investment (often just maintenance labor) but delivers immediate 15-20% savings on compressed air costs.
- Lighting Optimization: LED upgrades can slash lighting costs by 80%. Real-time monitoring identifies which zones consume the most lighting energy, helping prioritize upgrades.
- Basic Load Monitoring: Identify peak demand patterns and low-hanging fruit like equipment running unnecessarily during off-shifts.
Expected Phase 1 Savings: 8-12% energy reduction
Phase 2: System Integration
HVAC Optimization: Real-time monitoring reveals HVAC inefficiencies costing thousands monthly. Implement automated controls optimizing temperature setpoints, ventilation rates, and equipment cycling based on actual occupancy and production schedules. Typical savings: 15-25%.
Motor Efficiency Programs: Motors represent the largest electricity consumers in most manufacturing facilities. Deploy variable frequency drives (VFDs) on pumps, fans, and conveyors, allowing motors to run at optimal speeds rather than full-blast constantly. Energy savings: 20-35% on motor loads.
Power Quality Management: Address power factor issues through automated capacitor bank management. Poor power factor costs manufacturers 5-10% in efficiency losses and potential utility penalties. Correcting power factor delivers immediate savings with minimal capital investment.
Expected Phase 2 Savings: Additional 5-10% energy reduction
Phase 3: Advanced Analytics
Predictive Maintenance: Machine learning algorithms predict equipment failures weeks in advance by analyzing performance patterns. This prevents energy waste from degraded equipment while avoiding costly emergency repairs. Average maintenance cost reduction: 25%.
Energy Procurement Optimization: With granular consumption data, negotiate better utility rates and take advantage of demand response programs. Some facilities earn thousands monthly by strategically reducing load during peak pricing periods.
Sustainability Reporting Automation: Generate comprehensive ESG reports showing carbon emissions reductions, energy efficiency improvements, and regulatory compliance. This satisfies stakeholder demands while positioning your facility for green financing opportunities and sustainability incentives.
Expected Phase 3 Savings: Additional 3-7% energy reduction plus operational cost savings
Total 12-Month Results
Cumulative energy reduction: 16-29% on average
Typical payback period: 6-11 months
Ongoing annual savings: $420,000+ for large facilities
Implementation happens during normal operations with minimal disruption. Most sensor installations take minutes, not hours. Dashboard configuration happens remotely. And you start seeing savings within weeks of deployment, not years.
The Competitive Imperative You Can’t Afford to Ignore
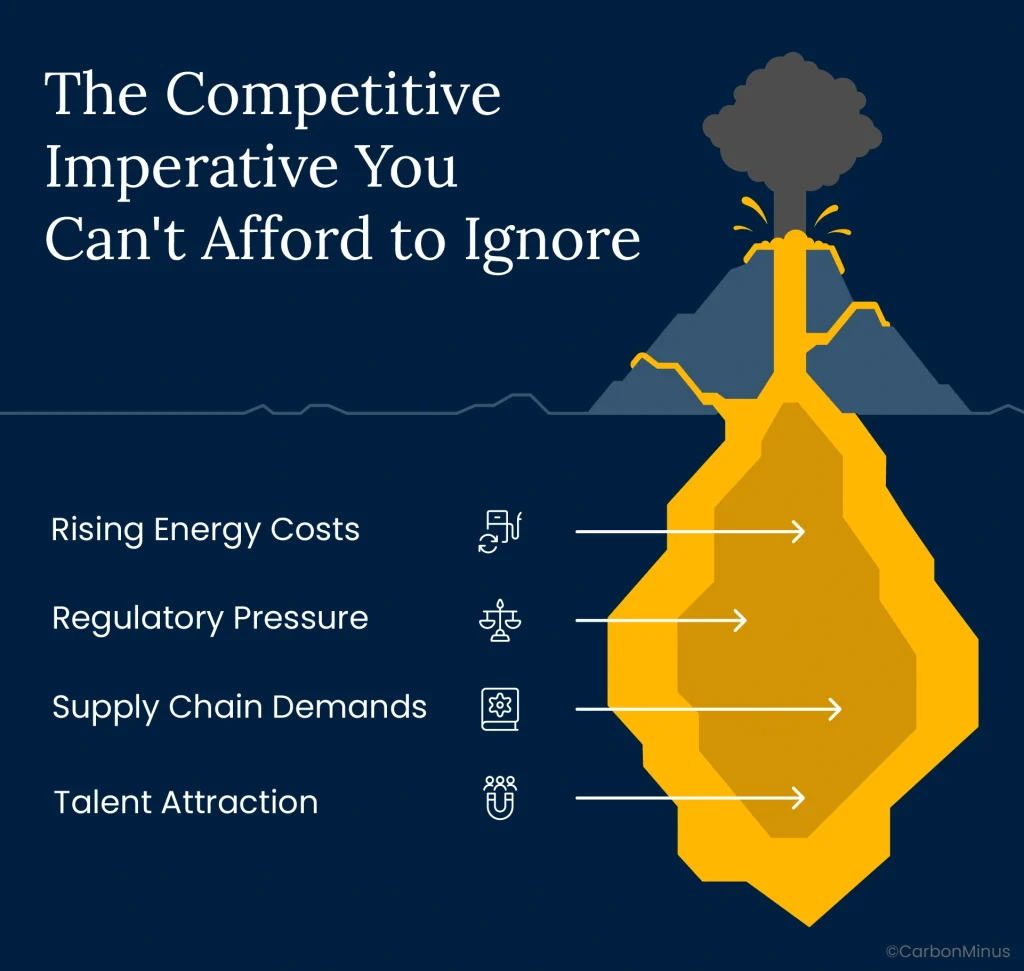
Rising Energy Costs
Industrial electricity prices have increased 8-12% annually over the past three years. Waiting for prices to drop is like waiting for gravity to reverse, it’s not happening. The only winning move is reducing consumption.
Regulatory Pressure
Environmental compliance requirements tighten every year. ISO 50001 energy management standards. BRSR sustainability reporting. State and federal emissions regulations. The compliance burden grows heavier, and penalties for non-compliance can reach $64.5 million. Manual tracking isn’t sustainable so automated monitoring is becoming necessary, not optional.
Supply Chain Demands
Major corporations now require sustainability metrics from suppliers. If you manufacture components for automotive, pharmaceutical, or consumer goods companies, expect increasing pressure to document energy efficiency and carbon footprint. Facilities without credible data risk losing contracts to competitors who can demonstrate measurable improvements.
Talent Attraction
Younger engineers and operators increasingly choose employers based on sustainability commitment. Facilities stuck in outdated energy management practices struggle to attract top talent. Real-time monitoring signals forward-thinking operations that appeal to skilled workers.
The Cost of Inaction
Here’s what staying with annual energy audits instead of upgrading to real-time monitoring actually costs:
Immediate Financial Loss: $420,000+ annually in unrealized savings. That’s budget that could fund equipment upgrades, workforce development, or profit distribution, which is instead leaking away through preventable inefficiencies.
Competitive Disadvantage: While you pay 15-20% more for energy than competitors using real-time monitoring, they reinvest those savings into innovation, capacity expansion, or price competition. Every quarter you delay widens the gap.
Operational Blind Spots: Without real-time visibility, equipment degradation goes undetected until catastrophic failure. Emergency repairs cost 3-5x more than planned maintenance. Production downtime costs thousands per hour. The lack of predictive capabilities literally costs you money while you sleep.
Regulatory Risk: Manual compliance tracking increases error probability. One audit finding of inadequate energy management documentation can trigger expensive remediation requirements and potential fines. Automated monitoring provides auditable records protecting against compliance risks.
The Dashboard Decision
This isn’t really about energy monitoring technology. It’s about competitive positioning.
Your competitors are making this investment. Forward-thinking manufacturers are deploying real-time dashboards and capturing 20% energy savings while you’re still scheduling annual audits.
The question isn’t whether real-time monitoring delivers value because the data is conclusive. The question is whether you’ll capture that value or leave it on the table for competitors to exploit.
Fred Smith didn’t save FedEx with a lucky blackjack hand. He saved it by betting on better information and having the courage to act when conventional wisdom said “wait”.
The $420K dashboard decision isn’t really gambling. It’s the safest bet you’ll make all year.
Your Next Move: Getting Started Without the Guesswork
If you’ve read this far, you’re probably thinking: “This makes sense for other manufacturers, but what about my specific facility? My unique equipment mix? My particular production constraints?”
Fair questions. Here’s how to get customized answers:
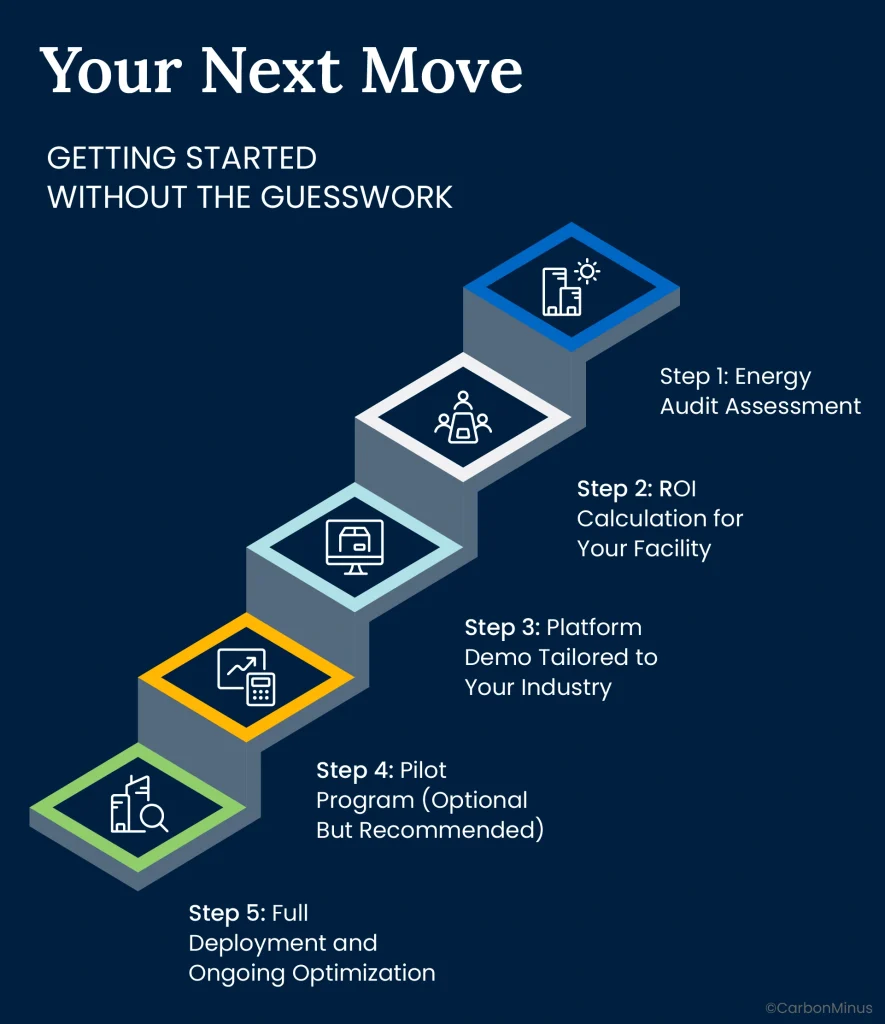
Step 1: Energy Audit Assessment
Before jumping into full deployment, understand your current monitoring capabilities. Most facilities discover they already have partial infrastructure like legacy meters, building management systems, isolated sensor networks, that can integrate into a comprehensive platform.
A proper assessment identifies:
- Existing metering and monitoring infrastructure
- High-priority energy consumers (typically 80% of consumption comes from 20% of equipment)
- Quick-win opportunities delivering immediate savings
- Integration requirements and potential challenges
Timeline: 1-2 weeks
Cost: Often included free with platform demos
Step 2: ROI Calculation for Your Facility
Generic industry averages are useful for benchmarking, but you need facility-specific projections. Quality energy monitoring providers offer ROI calculators incorporating your actual consumption data, equipment mix, production schedules, and utility rates.
This generates customized projections showing:
- Expected monthly savings by category (demand response, power factor, equipment optimization, etc.)
- Payback period based on your specific investment requirements
- Year-one through year-five cumulative savings
- Compliance and operational benefits quantified where possible
Timeline: 3-5 days after providing consumption data
Cost: Free from reputable providers
Step 3: Platform Demo Tailored to Your Industry
Don’t settle for generic software demonstrations. Insist on seeing dashboard capabilities configured for your specific industry—manufacturing, chemical processing, steel production, pharmaceutical, etc.
Key questions to ask during demos:
- How does the platform handle our specific equipment types and production processes?
- What integration is required with our existing building management systems?
- Can we see real-time alerts and predictive maintenance features in action?
- How long does typical deployment take for facilities our size?
- What training and support is included?
CarbonMinus offers industry-specific demos showcasing real-time monitoring capabilities for manufacturing facilities. The platform is hardware-agnostic, integrating with existing infrastructure to minimize deployment costs. And because it’s cloud-based with mobile access, your team can monitor energy consumption from anywhere.
Step 4: Pilot Program (Optional But Recommended)
For large facilities or organizations with multiple locations, consider starting with a pilot deployment. Implement real-time monitoring in one building, production line, or high-consumption area.
This approach:
- Proves ROI with minimal risk
- Allows team members to learn the platform gradually
- Generates internal champions who can advocate for wider rollout
- Provides facility-specific data for justifying full deployment
Timeline: 90-day pilot delivers measurable results
Cost: Fraction of full deployment investment
Step 5: Full Deployment and Ongoing Optimization
Once ROI is proven (typically within the first 3-6 months of pilot), expand real-time monitoring across the entire facility. The implementation roadmap outlined earlier which includes Phase 1 quick wins, Phase 2 system integration, and Phase 3 advanced analytics delivers progressive value while minimizing disruption.
Remember that energy optimization is a continuous journey, not a one-time project. The platform keeps finding new savings opportunities as production patterns shift, equipment ages, and energy markets evolve. Manufacturers report that Year 2 and Year 3 savings often exceed Year 1 results as teams become more sophisticated in using real-time data for decision-making.
Why Waiting Costs More Than Acting
Every month you delay implementing real-time energy monitoring, you’re making an active choice: Accept 5% savings from annual audits instead of capturing 20% through continuous optimization.
That 15-percentage-point difference isn’t abstract. For most large manufacturing facilities, it’s $35,000+ monthly. Over a year, that’s $420,000+ in unrealized savings. Over five years? More than $2.1 million left on the table.
And here’s what makes the decision even clearer: Unlike most efficiency investments, real-time monitoring pays for itself in 6-11 months. You’re not waiting 5-10 years for ROI. You’re seeing measurable returns within the same fiscal year you make the investment.
The technology exists. The case studies prove it works. The ROI is documented across industries. The only remaining question is whether you’ll capture this opportunity or leave it for competitors.
Fred Smith’s $5,000 blackjack gamble saved FedEx because he recognized when the risk of doing nothing exceeded the risk of acting boldly.
Your $420K dashboard decision is actually far safer. The odds aren’t 50-50—they’re heavily in your favor. And the potential upside isn’t just survival. It’s competitive advantage, operational excellence, and sustainable profitability.
The real gamble is staying with annual energy audits and hoping your competitors don’t discover what you’re missing.
Ready to See What $420K in Annual Savings Looks Like?
CarbonMinus helps manufacturing facilities across the US and India achieve measurable energy efficiency improvements with real-time monitoring dashboards that pay for themselves in under a year.
Our hardware-agnostic platform integrates seamlessly with your existing infrastructure, no costly equipment replacement required. AI-powered analytics deliver predictive maintenance, automated compliance reporting, and continuous optimization that keeps finding new savings opportunities year after year.
We’ve helped facilities save over 4,021 tCO2e in carbon emissions and generate ₹583,000+ in annual cost savings through intelligent energy management.
Schedule your customized ROI assessment and see exactly how much your facility could save with real-time energy monitoring. No generic estimates, just your specific consumption data, equipment mix, and industry requirements analyzed to show precise payback timelines and savings projections.
Because unlike Fred Smith’s blackjack hand, you shouldn’t have to gamble on whether energy efficiency pays off. You should know exactly what returns to expect and we’ll show you the math.
Contact CarbonMinus today to discover your facility’s $420K opportunity.
FAQs
How accurate is the $420K annual savings figure for my facility?
The $420K figure represents average savings for large manufacturing facilities (5-10 MW demand) achieving 20% energy reduction through real-time monitoring. Your actual savings depend on several factors: current energy consumption, facility size, equipment mix, existing efficiency levels, and local utility rates (US industrial average: $0.08/kWh).
Most facilities fall within a $250K-$600K annual savings range. The best approach is requesting a customized ROI assessment based on your actual consumption data. CarbonMinus provides facility-specific projections incorporating your unique operational parameters to show precise savings potential.
What’s the difference between real-time monitoring and traditional energy audits?
Traditional energy audits are static snapshots conducted annually or bi-annually. A consultant analyzes historical utility bills, walks through your facility, and provides recommendations based on past performance. They typically identify 5% savings opportunities, but implementation delays and lack of ongoing monitoring reduce actual results.
Real-time monitoring provides continuous 24/7 visibility through IoT sensors tracking every piece of equipment. The system identifies inefficiencies the moment they occur, sends instant alerts, and uses AI to predict equipment failures before they happen. This approach delivers 20% average savings—4x more effective than traditional audits.
Think of it this way: Traditional audits are like annual doctor checkups. Real-time monitoring is like wearing a continuous health monitor tracking your vitals every second.
Will implementation disrupt our production operations?
No. Modern real-time monitoring deploys in phases specifically designed to minimize disruption. Most sensor installations take minutes, not hours, and happen during normal operations without requiring production shutdowns.
The typical implementation timeline:
- Weeks 1-2: Assessment and planning (no facility disruption)
- Weeks 3-6: Sensor deployment during regular shifts
- Weeks 7-12: System optimization and team training
Dashboard configuration happens remotely. You start seeing savings within weeks of initial deployment, not months or years. Many facilities report that the biggest operational “disruption” is operators getting used to having real-time visibility they’ve never had before.
Do we need to replace our existing equipment and infrastructure?
Absolutely not. Quality real-time monitoring platforms are hardware-agnostic, meaning they integrate seamlessly with your existing equipment, meters, and building management systems.
CarbonMinus specifically designed its platform to work with legacy infrastructure, eliminating costly rip-and-replace scenarios. The system connects to existing meters, adds IoT sensors where needed, and creates a unified dashboard regardless of equipment age or manufacturer.
This dramatically reduces implementation costs (often by 40-60%) and accelerates deployment timelines. You’re optimizing assets you already own, not buying new ones.
How long does it really take to see ROI?
Most manufacturing facilities achieve full ROI in 6-11 months. Some see payback as quickly as 2-4 months depending on facility size, energy consumption patterns, and existing efficiency levels.
Here’s the typical timeline:
- Month 1: Initial savings from compressed air leak detection and lighting optimization
- Months 2-4: Progressive savings as HVAC, motors, and process equipment get optimized
- Months 5-8: Additional savings from predictive maintenance and demand response programs
- Months 9-12: Full system optimization delivering 16-29% total energy reduction
Research shows 70% of facilities report ROI above 10% with typical payback periods of 18-20 months. The $420K annual savings isn’t a one-time event—it compounds year after year as the platform continuously finds new optimization opportunities.
What happens if the system identifies problems our team can’t fix immediately?
Real-time monitoring platforms prioritize issues by severity, cost impact, and implementation difficulty. Not every alert requires immediate action.
The system categorizes findings into:
- Quick wins: Compressed air leaks, lighting left on unnecessarily, equipment running during off-hours—typically fixed within days using existing maintenance staff
- Medium-term projects: HVAC tuning, power factor correction, motor VFD installations—implemented over weeks or months as budget allows
- Long-term optimizations: Major equipment replacements, facility upgrades—planned strategically over years
Most facilities capture 60-70% of total savings potential just from quick wins and medium-term projects. You don’t need to fix everything immediately to see substantial ROI. The platform maintains a prioritized action list, tracking which opportunities deliver the highest savings per dollar invested.
How does real-time monitoring help with regulatory compliance?
Modern energy monitoring platforms automate compliance reporting for ISO 50001, BRSR (Business Responsibility and Sustainability Reporting), and environmental regulations.
The system maintains auditable records of:
- Energy consumption across all scopes (Scope 1, 2, and 3 emissions)
- Efficiency improvements and carbon reductions over time
- Equipment performance and maintenance schedules
- Demand response participation and renewable energy integration
What used to require weeks of manual data compilation now generates automatically with a few clicks. This reduces compliance workload by 50-70% while providing more accurate, comprehensive reporting. Plus, the platform creates the audit trail protecting against regulatory findings and potential fines (which can reach $64.5 million for serious violations).
Can real-time monitoring integrate with our existing building management system (BMS)?
Yes. Professional energy monitoring platforms include API integrations with major BMS providers including Honeywell, Siemens, Johnson Controls, Schneider Electric, and others.
The platform pulls data from your existing BMS while adding:
- IoT sensors for granular equipment-level monitoring
- AI-powered analytics identifying patterns your BMS doesn’t detect
- Predictive maintenance capabilities forecasting failures weeks in advance
- Mobile accessibility allowing remote monitoring and control
- Automated reporting for compliance and stakeholder communications
Think of real-time monitoring as the intelligence layer sitting on top of your existing infrastructure, extracting maximum value from assets you already own.
How does predictive maintenance reduce both energy costs and operational expenses?
Predictive maintenance uses AI algorithms analyzing equipment performance patterns to forecast failures weeks before they occur. This delivers dual benefits:
Energy savings: Equipment degradation increases energy consumption. A motor with worn bearings might draw 15-20% more power than normal. Catching this early prevents months of elevated energy costs.
Operational savings: Predictive maintenance enables planned repairs during scheduled downtime rather than emergency failures during production runs. This reduces maintenance costs by an average of 25% while avoiding costly production interruptions.
Example: A chemical plant using CarbonMinus identified unusual vibration and power draw patterns in a critical pump. Scheduled maintenance during a planned shutdown prevented what would have been a $180,000 emergency repair plus three days of lost production. The total avoided cost exceeded the facility’s entire annual platform subscription.
What kind of training does our team need to use the platform effectively?
Most platforms require minimal training—typically 2-4 hours for operators and facilities managers. If your team can use a smartphone or tablet, they can use real-time monitoring dashboards.
Training typically covers:
- Dashboard navigation and key metrics interpretation
- Setting up custom alerts and notifications
- Generating compliance and performance reports
- Understanding predictive maintenance recommendations
- Best practices for continuous optimization
CarbonMinus provides ongoing support including webinars, documentation, and responsive technical assistance. Many facilities designate an internal “energy champion” who receives deeper training and serves as the primary platform administrator. But the interface is designed for intuitive daily use without specialized technical expertise.
Can we start with a pilot program before full facility deployment?
Absolutely and we strongly recommend this approach for large facilities or multi-site operations.
A typical pilot program:
- Deploys real-time monitoring in one building, production line, or high-consumption area
- Runs for 90 days to prove ROI with minimal investment
- Generates facility-specific data for justifying full deployment
- Allows team members to learn the platform gradually
- Creates internal champions who advocate for wider rollout
Pilot programs typically cost 20-30% of full deployment while delivering measurable savings that accelerate buy-in from finance and operations teams. Once ROI is proven (usually within 3-6 months), expanding to the full facility becomes an easy business decision.