TL;DR
- 282 Indian facilities across cement, aluminum, pulp & paper, and chlor-alkali now face legally binding GEI (emissions intensity) targets for FY 2025-27
- Beat your target = earn tradable Carbon Credit Certificates from BEE worth ₹830-1,000/tonne; miss target = pay 2x penalty
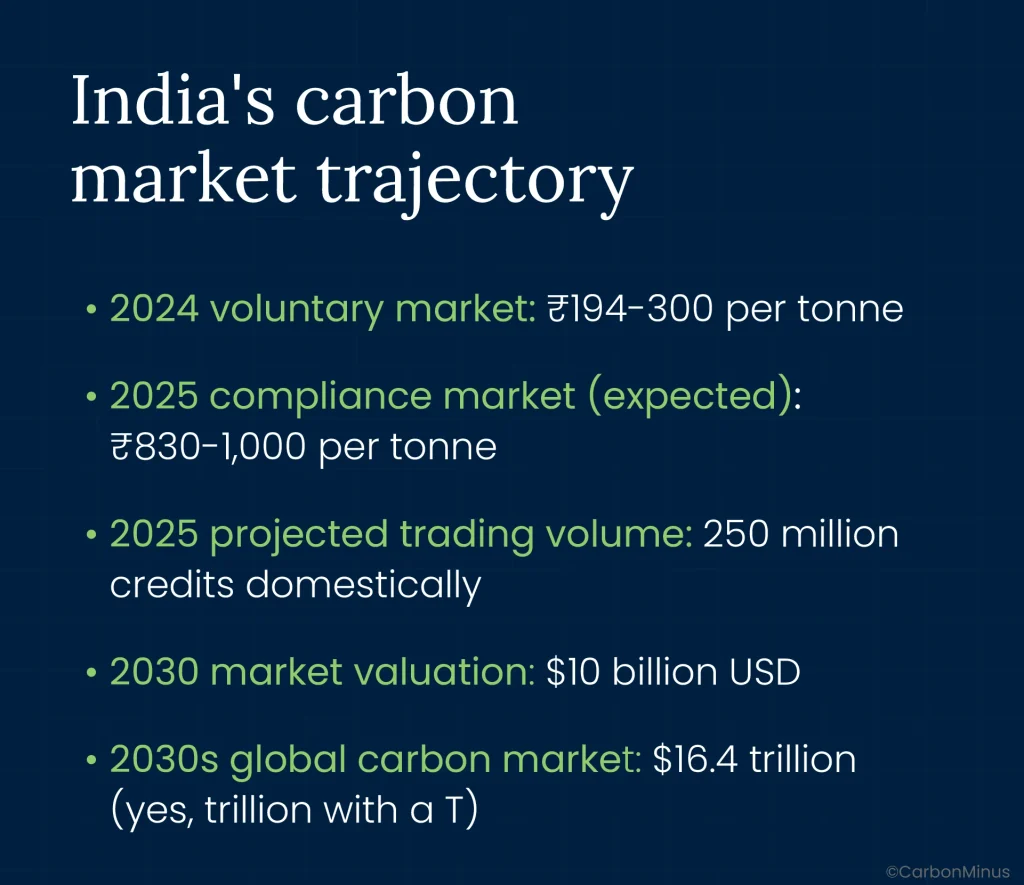
- India’s carbon market projected at $10 billion by 2030, with 250 million credits trading in 2025
- Revenue opportunity example: A cement plant beating its 3.4% target by just 1% can generate ₹60+ lakhs annually in tradable credits
- Infrastructure is everything: Real-time MRV (Measurement, Reporting, Verification) systems with IoT sensors and AI analytics achieve 4x better results than manual tracking
- Multi-benefit play: Same infrastructure enables energy savings (6-15%), CBAM export compliance, ESG financing, and predictive maintenance
- Early mover advantage: FY 2023-24 baseline is closed; facilities without proper tracking must backfill data now
- Proven ROI: 18-20 month payback periods, with energy efficiency investments delivering multiple revenue streams
- Action now: Audit baseline data, calculate credit potential, deploy monitoring systems before 2025-26 compliance year peaks
Dr. Harry Coover was trying to make clear plastic gun sights during World War II when he stumbled upon something completely different—a substance that stuck to everything it touched. Frustrated, he tossed it aside. Nine years later, he realized that his “failure” was actually superglue, a product now worth billions.
Sometimes the biggest opportunities hide inside what looks like a problem.
On October 8, 2025, India’s Ministry of Environment quietly dropped a notification that 282 industrial facilities initially saw as just another compliance headache: legally binding Greenhouse Gas Emissions Intensity (GEI) targets for cement, aluminum, pulp & paper, and chlor-alkali sectors. Most plant heads groaned. A few did the math.
Those few realized India just turned pollution permits into tradable financial instruments.
The Carbon Credit Trading Scheme (CCTS) isn’t asking you to go net-zero or plant trees for Instagram. It’s offering something far more tangible: beat your emissions intensity target, earn Carbon Credit Certificates from the Bureau of Energy Efficiency, and sell them for actual rupees. Miss your target? Pay double the market price in penalties.
This is carbon as currency. And the market is already valuing it at ₹830-1,000 per tonne for compliance credits with India’s total carbon market projected to hit $10 billion by 2030.
Your competitors who figure this out first aren’t just meeting compliance. They’re building new profit lines while you’re still deciding whether carbon matters.
What Just Changed: From PAT to Profit
The regulatory shift everyone’s talking about
India’s new GEI Target Rules mark a fundamental departure from the old Perform, Achieve, and Trade (PAT) scheme. PAT focused on energy efficiency, how much energy you consumed per unit of output. CCTS focuses on emissions intensity, how much CO₂ equivalent you emit per unit of product.
The distinction matters because emissions intensity captures both your energy use AND your fuel mix. Switch from coal to solar? Your GEI drops even if total energy consumption stays flat. Install waste heat recovery? You reduce both energy costs and emissions per tonne.
Here’s who’s in the hot seat:
- Cement: 186 facilities must cut emissions intensity by 3.4% over two years
- Aluminum: 13 smelters face a steeper 5.8% reduction target
- Pulp & Paper: 53 mills need to achieve 7.1% cuts
- Chlor-alkali: 30 plants are mandated to reduce by 7.5%
The timeline that matters:
- Baseline year: FY 2023-24 (already closed—more on this nightmare later)
- Compliance period: FY 2025-26 and 2026-27 (happening NOW)
- Reporting authority: Central Pollution Control Board (CPCB) under Ministry of Environment oversight
This isn’t a voluntary pledge. This is India’s first legally binding carbon performance standard backed by financial consequences.
The Triple Win: Where Money Actually Gets Made
Understanding the three possible outcomes
Every facility covered by CCTS will land in one of three buckets by 2027. The financial difference between them is measured in crores.
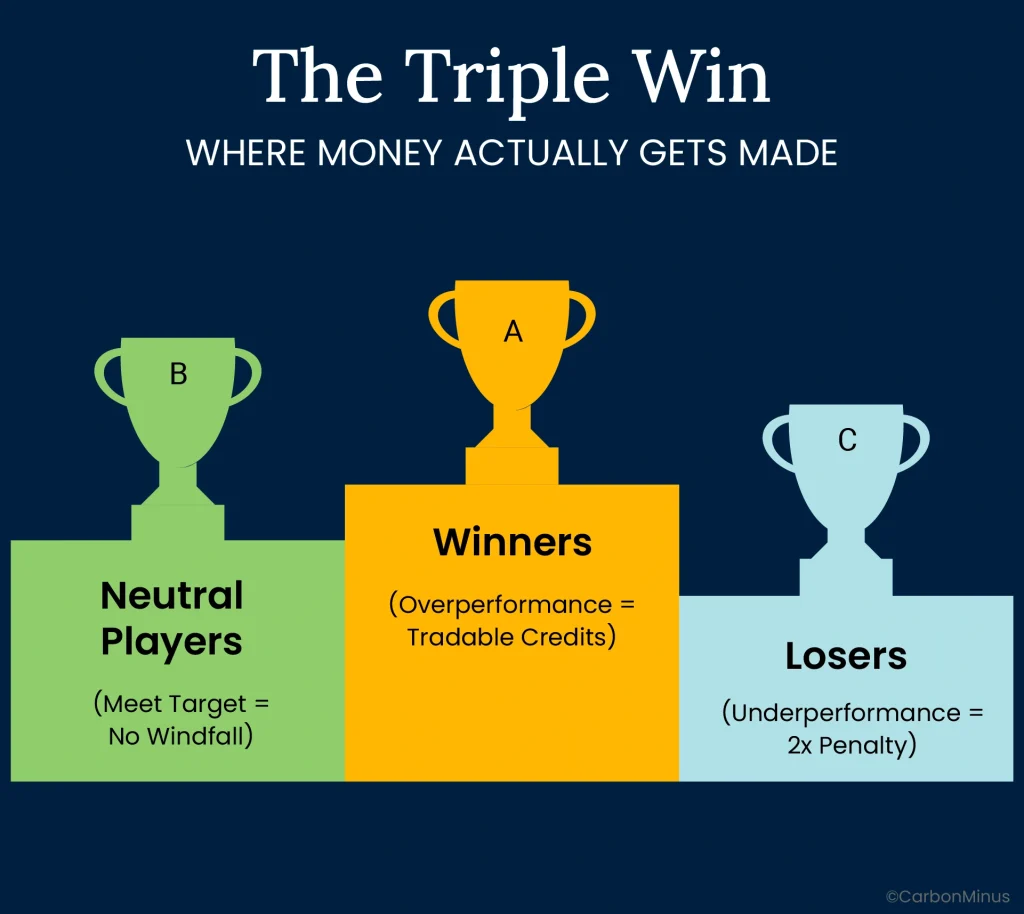
Outcome A: The Winners (Overperformance = Tradable Credits)
Let’s say your cement plant has a mandated 3.4% emissions intensity reduction target. You invest in waste heat recovery, optimize your kiln operations, and switch 20% of your power to solar. By FY 2026-27, you’ve achieved a 4.5% reduction, beating your target by 1.1 percentage points.
That surplus becomes Carbon Credit Certificates (CCCs) issued by BEE. These credits are:
- Tradable on India’s national carbon market
- Bankable for future compliance years (critical for strategic planning)
- Monetizable at current compliance market prices of ₹830-1,000 per tonne
The math for a mid-sized cement facility:
- Annual production: 1 million tonnes cement
- Baseline GEI (FY 2023-24): 0.62 tCO₂e per tonne (industry average)
- Total baseline emissions: 620,000 tCO₂e
- Required reduction (3.4%): 21,080 tCO₂e
- Actual reduction achieved (4.5%): 27,900 tCO₂e
- Surplus credits generated: 6,820 tCO₂e
- Market value at ₹900/tonne: ₹61.38 lakhs
Scale that across a corporate group operating five such facilities, and you’re looking at ₹3+ crores in annual credit revenue—from doing what you should have been doing anyway to control energy costs.
Outcome B: The Neutral Players (Meet Target = No Windfall)
You hit exactly 3.4% reduction. No penalty. No profit. But here’s what you’re missing:
Your competitor who beat the target by just 0.5% banked credits they can either sell today or hold for 2026-27 when credit prices may be higher due to scarcity. You left money—and strategic flexibility—on the table.
Outcome C: The Losers (Underperformance = 2x Penalty)
Even a small shortfall of 0.1% can lead the CPCB to impose “environmental compensation” equal to twice the average market price of carbon credits for that compliance year. With Carbon Credits 2025 shaping the benchmark for future valuations, the financial impact of non-compliance is only set to rise.
The penalty calculation –
If the average compliance credit price in FY 2025-26 is ₹900/tonne, and your 1-million-tonne cement facility underperforms by 1% (6,200 tCO₂e shortfall):
- Penalty rate: ₹900 × 2 = ₹1,800 per tCO₂e
- Total penalty: 6,200 × ₹1,800 = ₹1.12 crores
- Payment deadline: 90 days from imposition order
- Funds collected go to CPCB for CCTS implementation—you can’t even reinvest it in your own upgrades
Now imagine you operate 10 facilities. Do that math.
When every tonne of CO₂e avoided can generate credits, energy optimization becomes a revenue stream, not just a cost-saving measure.
The Market Opportunity: From Tons to Crores
Sizing India’s carbon credit gold rush
Let’s ground this in real numbers, not aspirational projections.
Global context: Tesla earned over $10 billion from carbon credit sales between 2017 and 2023 by outperforming emissions standards in the automotive sector. They didn’t make better cars to be nice, they monetized regulatory frameworks.
Who’s generating credits right now?
The “early mover” advantage under CCTS is strongest for companies that previously participated in PAT cycles, already have energy management infrastructure in place, and understand that data quality determines credit eligibility. When you compare CCTS to PAT, it becomes clear that firms with prior PAT compliance experience are far better positioned to monetize emissions reductions under the newer carbon trading framework.The “early movers” positioning for CCTS include companies that participated in PAT cycles, have existing energy management infrastructure, and understand that data quality = credit eligibility.
Industries with co-benefits are winning fastest: a pulp & paper mill installing cogeneration doesn’t just reduce GEI—it also cuts power purchase costs by 40%, generates surplus electricity to sell to the grid, and creates waste heat for process steam. Triple revenue stream from one capital investment.
Sector-by-sector revenue potential
Let’s calculate conservatively, assuming only the top 30% of facilities in each sector beat targets by an average of 1% beyond requirements (entirely achievable with proper infrastructure):
| Sector | Facilities | Avg Annual Production | Target Reduction | Overperformers (30%) | Surplus per Facility | Credit Value (@₹900/t) | Sector Total |
| Cement | 186 | 1M tonnes | 3.4% | 56 facilities | 6,200 tCO₂e | ₹55.8 lakhs | ₹31.2 crores |
| Aluminum | 13 | 500K tonnes | 5.8% | 4 facilities | 14,500 tCO₂e | ₹1.31 crores | ₹5.2 crores |
| Pulp & Paper | 53 | 200K tonnes | 7.1% | 16 facilities | 8,800 tCO₂e | ₹79.2 lakhs | ₹12.7 crores |
| Chlor-alkali | 30 | 150K tonnes | 7.5% | 9 facilities | 11,250 tCO₂e | ₹1.01 crores | ₹9.1 crores |
Conservative annual credit revenue from overperformance across Phase 1 sectors: ₹58+ crores
This assumes modest outperformance. Plants investing in comprehensive energy optimization—waste heat recovery, AI-driven load management, renewable integration—regularly achieve 2-3% improvement beyond baseline. Scale those numbers.
And remember: Phase 1 covers just 4 of 9 planned sectors. Steel, refining, and petrochemicals are coming. When they join CCTS, multiply these numbers by 3-5x.
The Infrastructure Challenge: You Can’t Trade What You Can’t Measure
Why most plants will fail at the data layer
Here’s the uncomfortable truth: generating carbon credits isn’t about good intentions. It’s about investment-grade data infrastructure.
CCTS requires you to prove, down to the shift level, exactly how much CO₂ equivalent you emitted per unit of output. Not estimates. Not industry benchmarks. Your actual, auditable, timestamped emissions tied to your actual, verified production.
That’s what “GEI = tCO₂e per unit of output” means in practice.
What GEI actually measures (and why it’s harder than it sounds)
The formula looks simple:
GEI = (Scope 1 + Scope 2 emissions) ÷ Output
Breaking that down:
Scope 1 emissions (direct)
- Fuel combustion in kilns, furnaces, boilers
- Process emissions (e.g., calcination in cement production releasing CO₂ from limestone)
- On-site vehicles and equipment
- Refrigerant leakage
Scope 2 emissions (indirect)
- Purchased electricity (using grid emission factors)
- Imported steam or cooling
Output
- Measured in sector-specific units (tonnes of clinker, alumina, paper, caustic soda)
- Must align temporally with emissions—you can’t match March emissions with February production
Your monthly utility bill tells you total kWh consumed. It doesn’t tell you that Kiln #2 used 8% more fuel per tonne than baseline because its refractory lining is degrading. It doesn’t flag that your compressed air system leaked 30% of generated air during the night shift. It doesn’t detect that idle equipment consumed energy without producing output, artificially inflating your GEI.
Why manual systems leave money on the table
Most plants trying to calculate GEI manually face these gaps:
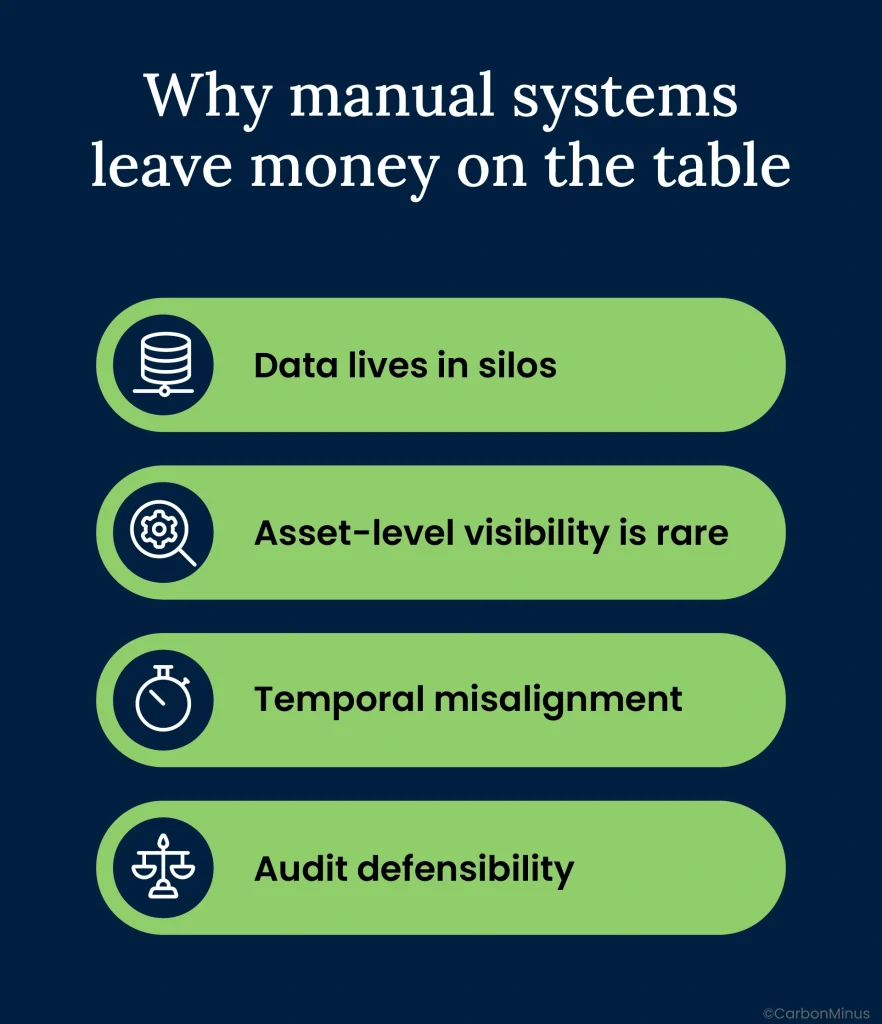
Data lives in silos
- Operations tracks production (ERP system)
- Utilities track energy consumption (SCADA, meters)
- Sustainability team compiles reports (spreadsheets)
- Nobody’s data talks to each other in real time
Asset-level visibility is rare
- You know plant-wide consumption
- You don’t know which specific assets are underperforming
- Can’t optimize what you can’t see
Temporal misalignment
- Production reported daily
- Energy bills arrive monthly
- Emissions calculated quarterly
- Credit eligibility requires hourly or shift-level precision
Audit defensibility
- Spreadsheets are error-prone and easily manipulated
- No automatic change logs or version control
- Third-party verifiers reject credits based on weak data provenance
The result? You might actually be overperforming on GEI, but you can’t prove it. No proof = no credits = no revenue.
The Real-Time Advantage: How Infrastructure Creates Credits
Building the data-to-dollar pipeline
Companies generating high-integrity carbon credits aren’t using clipboards and Excel. They’ve built what the industry calls automated MRV (Measurement, Reporting, Verification) infrastructure.
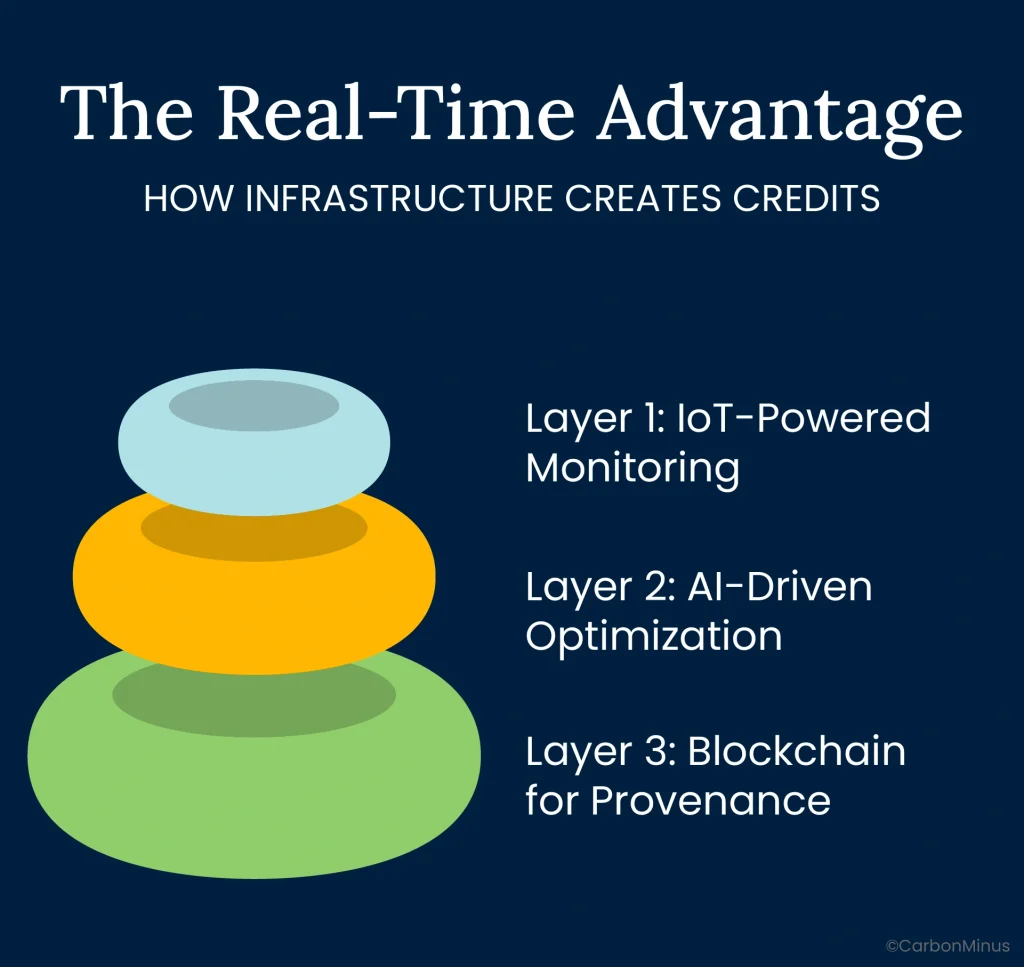
Here’s the stack:
Layer 1: IoT-Powered Monitoring
What it does:
- Real-time tracking of energy consumption, fuel use, emissions, and production output at the asset level
- Timestamped, machine-generated data (not manual entry)
- Auto-sync with CPCB and BEE reporting formats
Why it matters for credits:
- Proves reductions are real (not statistical artifacts)
- Proves reductions are additional (beyond business-as-usual)
- Proves reductions are measurable (audit-grade precision)
Example: A cement kiln fitted with IoT sensors on fuel flow, exhaust gas analyzers, and clinker production weighbridges generates minute-by-minute GEI data. When plant operators adjust kiln temperature or fuel mix, they see immediate impact on emissions intensity. Over time, AI learns optimal operating envelopes for minimum GEI.
ROI beyond credits: This same infrastructure flags anomalies before they become failures. Predictive maintenance reduces downtime by 14%, compounding your cost savings.
Layer 2: AI-Driven Optimization
What it does:
- Analyzes patterns across shifts, products, demand profiles
- Detects idle assets consuming without producing (GEI killers)
- Flags underperforming equipment (e.g., compressors running at 60% efficiency)
- Recommends operational changes to minimize emissions intensity
Why it matters for credits:
- Real-time monitoring delivers 4x better results than traditional annual audits (20% savings vs. 5%)
- Optimization happens continuously, not just during audit cycles
- Compounds improvements year-over-year
Example: AI detects that one production line consistently has 12% higher GEI than others making the same product. Root cause analysis reveals its cooling system is oversized and cycling inefficiently. Fix costs ₹15 lakhs. Annual GEI improvement generates credits worth ₹42 lakhs. Payback in 4.3 months.
Layer 3: Blockchain for Provenance
What it does:
- Creates immutable ledger recording each credit’s journey from creation → issuance → sale → retirement
- Prevents double-counting (same reduction claimed twice)
- Enables smart contracts to automate credit trading
Why it matters for credits:
- Premium buyers demand blockchain-verified credits, they pay 15-25% more for provenance
- Speeds up verification and registry integration
- Positions you for international carbon market trading under Article 6.2 of Paris Agreement
Example: Your facility generates 10,000 surplus credits in FY 2025-26. Blockchain timestamps creation, BEE verification, listing on trading platform, and sale to a corporate buyer needing offsets for BRSR reporting. When buyer retires the credit, it’s permanently marked so no one else can claim it. This trust infrastructure is what separates junk credits (₹200/tonne) from premium compliance credits (₹900+/tonne).
The integration advantage: Hardware agnosticism
Here’s what separates best-in-class platforms from legacy energy management systems: you don’t need to rip and replace your existing infrastructure.
Modern MRV platforms integrate with:
- Existing meters, sensors, and SCADA systems
- ERP systems (SAP, Oracle) for production data
- CPCB and BEE reporting portals
- Carbon credit registries (Verra, Gold Standard, CCTS)
Why this matters financially: Capital expenditure drops from “₹2-5 crores for full infrastructure overhaul” to “₹30-80 lakhs for software integration and incremental sensors”. Payback period compresses from 5-7 years to 18-20 months.
The Early Mover Advantage: Why 2025 Is the Window
What happens if you wait until 2026
“Let’s see what our competitors do first.”
That’s the most expensive sentence in industrial carbon strategy right now.
The baseline data gap
FY 2023-24 was your baseline year. It’s already closed. CPCB will judge your 2025-27 performance against that baseline.
Problem: Most facilities weren’t tracking GEI properly during FY 2023-24 because the rules weren’t finalized yet. Now they’re scrambling to backfill data from shift logs, SCADA exports, energy bills, and production records.
Best case: You reconstruct a defensible baseline using partial data.
Worst case: You’re stuck with a generic industry benchmark that assumes you were more efficient than you actually were—making your target harder to beat.
Early mover advantage: Facilities that started tracking in FY 2023-24 (or earlier, under PAT schemes) have clean baseline data and can accurately model credit generation potential.
The credit banking opportunity
Surplus credits earned in FY 2025-26 can be banked for FY 2026-27. This creates strategic optionality:
Scenario 1 (Sell immediately): Credit prices in early 2026 are ₹850/tonne. Market is liquid but not yet scarce. You sell 5,000 credits for ₹42.5 lakhs.
Scenario 2 (Bank for later): By late 2026, as more facilities approach compliance deadlines, credit scarcity drives prices to ₹1,100/tonne. You sell those same 5,000 credits for ₹55 lakhs. 28% higher return just from timing.
Scenario 3 (Hedge future performance): Your 2026-27 production ramps up unexpectedly, increasing absolute emissions. Instead of buying expensive credits or paying 2x penalties, you retire banked credits from 2025-26.
Companies without infrastructure in 2025 can’t bank on anything. They enter 2026-27 with zero strategic flexibility.
Learning curve and system stabilization
Implementing MRV infrastructure takes 6-12 months from procurement to full operation. That includes:
- Sensor installation and integration (2-3 months)
- Data pipeline configuration and testing (1-2 months)
- Staff training and SOPs (1 month)
- First audit cycle and calibration (2-3 months)
Start in Q4 2025, and you’re operational by mid-2026—capturing partial data for the first compliance year but missing peak credit generation opportunities.
Start now, and you have full-year 2025-26 data at audit-grade quality.
Beyond Compliance: Strategic Value Creation
How carbon intensity becomes a financial position
Smart CFOs don’t see CCTS as “sustainability compliance.” They see carbon intensity as a financial position to be managed and optimized like foreign exchange exposure or commodity hedging.
Multiple revenue streams from one infrastructure investment
1. Carbon credit sales (direct monetization)
- ₹830-1,000/tonne for compliance credits
- ₹1,200-2,000/tonne for premium nature-based or removal credits
2. Energy cost savings (operational efficiency)
- 6-15% reduction in energy costs documented across manufacturing sectors
- For a plant spending ₹10 crores annually on energy: ₹60 lakhs – ₹1.5 crores annual savings
3. Avoided penalties (risk mitigation)
- Preventing 2x environmental compensation charges
- For 1% non-compliance on 50,000 tCO₂e facility: ₹90 lakhs penalty avoided
4. Premium pricing and supply chain advantages (market positioning)
- 43% of customers won’t pay premium for products without green certifications
- Preferred supplier status for carbon-conscious buyers
- 2-8% price premium for verified low-carbon products
5. ESG-linked financing (cheaper capital)
- Companies with higher ESG scores perform 50% better than peers
- Access to green bonds, sustainability-linked loans at 20-50 bps lower rates
- ₹25-75 lakhs annual interest savings on ₹50 crore debt
Single investment, five ROI streams. That’s the strategic advantage competitors without infrastructure can’t replicate.
CBAM readiness: Turning domestic compliance into export advantage
Starting in 2026, the EU’s Carbon Border Adjustment Mechanism (CBAM) requires exporters to report product-level carbon intensity for cement, aluminum, steel, and chemicals entering European markets. Fail to provide verified data? Face tariffs equal to EU carbon price, currently €80-100 per tonne (₹7,200-9,000).
Here’s the kicker: The MRV infrastructure you build for CCTS directly satisfies CBAM reporting requirements.
Example: An Indian cement manufacturer exporting 100,000 tonnes annually to Europe must report embedded carbon per tonne. With CCTS-grade data infrastructure:
- Provides audit-ready GEI calculations
- Demonstrates reductions year-over-year (qualifies for preferential treatment)
- Avoids CBAM tariffs worth ₹72-90 lakhs annually
Without infrastructure, they either pay the tariff or lose export contracts to competitors who can prove lower carbon intensity.
Integration with Industry 4.0: Data leverage across functions
The IoT sensors, AI analytics, and real-time monitoring you deploy for carbon management don’t just track emissions. They become the digital backbone for broader operational intelligence:
- Predictive maintenance: Same sensors flag equipment degradation before failure
- Quality control: Process parameters optimized for both emissions AND product consistency
- Production planning: Align high-emission processes with low-cost renewable energy hours
- Asset performance management: Benchmark equipment across facilities
One Fortune 500 chemical manufacturer implementing energy monitoring for PAT compliance discovered their compressed air system was consuming 35% more than necessary. Fixing leaks and optimizing pressure saved ₹1.2 crores annually, completely separate from carbon credits.
Data leverage principle: Build once, monetize across multiple use cases.
What You Need to Do Right Now
Immediate action steps (next 30 days)
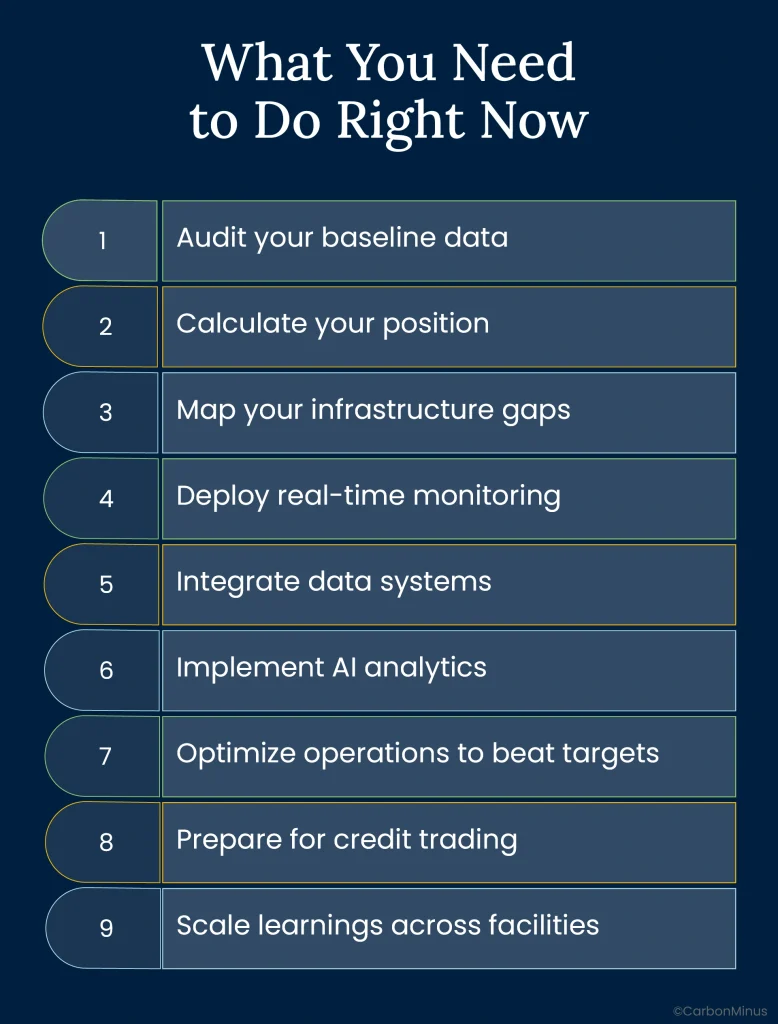
1. Audit your baseline data
Reconstruct FY 2023-24 emissions and production records:
- Fuel consumption logs (coal, gas, diesel, furnace oil)
- Electricity bills and meter readings
- Process emission data (if applicable—critical for cement)
- Production output by product type
Tools: Shift logs, SCADA exports, utility invoices, production reports. Get your energy manager, operations head, and compliance officer in the same room.
2. Calculate your position
Are you on track to overperform, meet, or underperform GEI targets?
Run three scenarios:
- Business-as-usual: What’s your projected GEI if nothing changes?
- Low-hanging fruit: Add quick wins (leak fixes, LED upgrades, load scheduling)
- Infrastructure investment: Model impact of waste heat recovery, renewables, process optimization
Output: Know whether you’re playing offense (credit generation) or defense (penalty avoidance).
3. Map your infrastructure gaps
Where does your data break down?
- Do you have asset-level metering on high-emission equipment?
- Can you align energy consumption with production output by hour/shift?
- Is your data audit-ready or would a third-party verifier reject it?
Identify: Top 5 assets contributing to GEI + top 3 data blind spots.
Short-term actions (3-6 months)
4. Deploy real-time monitoring
Install IoT sensors on critical emission sources:
- Kilns, furnaces, boilers (fuel flow + exhaust gas)
- Major electrical loads (motors, compressors, chillers)
- Renewable generation (solar, waste heat recovery)
Budget: ₹30-80 lakhs for mid-sized facility (sensor hardware + integration)
Payback: 18-20 months from energy savings + credit generation
5. Integrate data systems
Connect operations, utilities, and sustainability data into unified platform:
- Auto-calculate GEI by shift/product/line
- Generate CPCB-format reports
- Flag deviations from target trajectory in real time
Avoid: Building custom internal systems use platforms designed for CCTS/CBAM compliance
6. Implement AI analytics
Enable:
- Drift detection (when GEI trends above target)
- Optimization recommendations (operational changes to reduce intensity)
- Predictive alerts (maintenance needs before efficiency drops)
ROI: AI-driven systems achieve 4x better results than manual management
Long-term positioning (6-12 months)
7. Optimize operations to beat targets
Use data insights to:
- Eliminate idle load consumption
- Reuse waste heat for process applications
- Shift high-emission processes to solar hours
- Upgrade underperforming assets (compressors at 60% efficiency → 90%)
Target: 1-2% GEI improvement beyond mandated reductions = credit generation
8. Prepare for credit trading
Understand:
- BEE certificate issuance process
- Carbon market trading mechanics
- Registry requirements and verification protocols
Engage: Carbon market advisors or platforms with registry integration
9. Scale learnings across facilities
Replicate infrastructure to:
- Other plants in your corporate group
- Facilities in sectors joining CCTS Phase 2 (steel, refining coming)
Advantage: Shared learning curve + volume discounts on technology + centralized carbon desk managing portfolio
The Carbon Gold Rush Is Already Underway
Remember Dr. Coover and his superglue? The difference between failure and fortune wasn’t the chemistry, it was recognizing that what looked like a problem was actually an asset.
On October 8, 2025, India formalized GEI targets for 282 industrial facilities. Most plant heads saw a compliance burden. A few saw carbon credits worth ₹830-1,000 per tonne. Fewer still realized that the real opportunity isn’t just selling credits, it’s the multi-layered value creation from optimizing emissions intensity:
✓ Credit revenue from overperformance
✓ Energy cost savings (6-15% documented reductions)
✓ Penalty avoidance (2x market price for non-compliance)
✓ CBAM readiness for export markets
✓ ESG-linked financing at lower rates
✓ Competitive positioning in carbon-conscious supply chains
India’s carbon market is projected to reach $10 billion by 2030, with 250 million credits trading domestically in 2025 alone. The global carbon market is on track to $16.4 trillion by 2034.
This isn’t a someday opportunity. The buyers exist. The market is real. The regulatory framework is operational.
The only question: Are you building infrastructure to capture it, or are you still treating carbon as someone else’s problem?
Because here’s what’s already true—your competitors who figure this out first aren’t just meeting compliance. They’re generating new P&L lines, accessing cheaper capital, protecting export margins, and positioning for the next wave of sectoral expansion.
2025 is here. But it’s not too late.
Plants that track, optimize, and verify emissions intensity now will lead on cost, compliance, and carbon for the next decade. The infrastructure you deploy this year becomes your competitive moat in 2027.
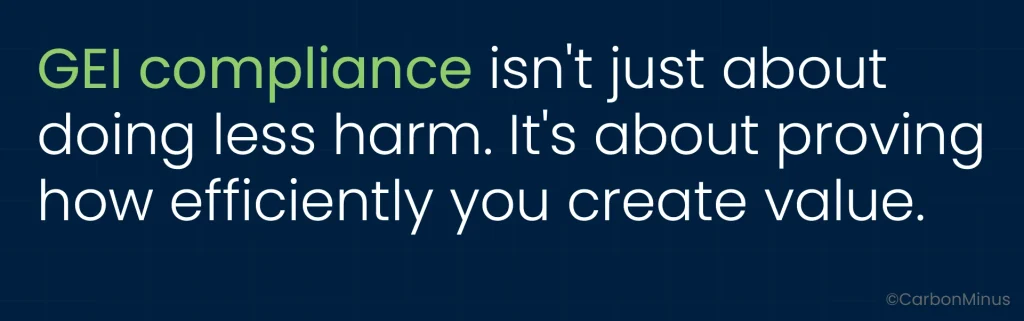
GEI compliance isn’t just about doing less harm. It’s about proving how efficiently you create value and getting paid for it in tradable credits.
The gold rush has started. Your move.
Want to calculate your facility’s ROI generation potential?
Run the numbers through CarbonMinus’s ROI calculator at carbonminus.com/roi to see what energy efficiency could mean for your operation.
For more details book a demo at https://carbonminus.com/contact-us/
FAQs
What is CCTS and how does it create revenue?
India’s Carbon Credit Trading Scheme (CCTS) converts emissions performance into tradable financial instruments. Beat your GEI (emissions intensity) target, earn Carbon Credit Certificates from BEE worth ₹830-1,000/tonne, and sell them on India’s carbon market. Miss targets? Pay double the market price in penalties.
Which industries must comply with GEI targets?
282 facilities across cement (186 plants), aluminum (13 smelters), pulp & paper (53 mills), and chlor-alkali (30 plants) face legally binding GEI targets for FY 2025-27. Steel, refining, petrochemicals, fertilizers, and textiles join in Phase 2, expanding to 461 obligated entities across 9 sectors.
Can my plant generate carbon credits or just top performers?
Any facility beating its baseline GEI target earns surplus credits, you don’t need best-in-class status. A cement plant reducing emissions intensity by 4.5% against a 3.4% target generates tradable credits from that 1.1% surplus. Performance is measured against your own baseline, not industry leaders.
What infrastructure is needed to generate credits?
Three essentials: IoT sensors on high-emission assets, AI-powered MRV (Measurement, Reporting, Verification) software for real-time GEI tracking, and blockchain provenance for credit integrity. Investment: ₹30-80 lakhs for hardware-agnostic integration, delivering 18-20 month payback from energy savings plus credit revenue.
What if my FY 2023-24 baseline data is incomplete?
Backfill immediately using shift logs, energy bills, SCADA exports, and fuel invoices. Document your methodology transparently, verifiers accept reasonable reconstructions. Worst case: you’re assigned sector benchmarks that may assume higher efficiency than actual, making targets harder to beat and credit generation tougher.
How is CCTS different from the old PAT scheme?
PAT focused on energy efficiency (energy per output unit); CCTS measures emissions intensity (CO₂e per output), capturing both energy use and fuel mix. Key advantage: switching to renewables directly reduces GEI even if total energy stays flat. Credits are now tradable financial instruments, not just compliance certificates.
Do renewable energy investments improve my GEI score?
Yes, significantly. Switching 20% of grid power (0.7 tCO₂e/MWh) to solar can reduce Scope 2 emissions by thousands of tonnes annually. For a 1-million-tonne cement facility, this translates to meaningful GEI improvements when targets are 3-7%. Combine renewables with efficiency upgrades for maximum credit generation.
What happens if I miss my GEI target?
CPCB imposes environmental compensation equal to 2x the average market price of carbon credits. Example: 1% underperformance (6,200 tCO₂e shortfall) at ₹900/tonne credit price = ₹1.12 crore penalty payable within 90 days. Funds go to CPCB for CCTS implementation, you can’t reinvest in your own upgrades.
Can surplus credits be banked for future compliance years?
Yes. Credits earned in FY 2025-26 can be banked for FY 2026-27, creating strategic optionality. This hedges against future production ramps that increase absolute emissions or lets you sell when credit scarcity drives prices higher (₹850/tonne early 2026 vs. projected ₹1,100+ late 2026).
How does CCTS compliance help with EU CBAM exports?
The MRV infrastructure for CCTS directly satisfies EU Carbon Border Adjustment Mechanism (CBAM) reporting requirements starting 2026. Audit-ready GEI data proves low carbon intensity, avoiding CBAM tariffs worth €80-100/tonne (₹7,200-9,000). For 100,000-tonne annual exports, that’s ₹72-90 lakhs in avoided tariffs.
What’s the ROI timeline for CCTS infrastructure investment?
Payback period: 18-20 months from combined revenue streams. Beyond carbon credit sales (₹830-1,000/tonne), facilities achieve 6-15% energy cost reductions, avoid 2x penalties, access ESG-linked financing at 20-50 bps lower rates, and gain predictive maintenance savings. One infrastructure investment, five ROI streams.
Why should I act now instead of waiting for 2026?
FY 2023-24 baseline is closed, late starters struggle with incomplete data. Early movers capture full FY 2025-26 credit generation, bank credits when prices are lower, and benefit from learning curves in MRV implementation. Infrastructure deployment takes 6-12 months; starting Q4 2025 means missing peak 2026 credit opportunities.