TL;DR
- Puerto Rico manufacturers pay 173% more for electricity than mainland competitors (24.22¢/kWh vs 8.86¢/kWh)
- Demand response programs pay manufacturers $1.00-$1.25/kWh to reduce load during grid stress periods
- Cleveland-Cliffs earns $500K-$1M annually from DR while cutting peak costs by 50%with zero production impact
- Automated systems respond in 10 minutes without manual intervention or disrupting operations
- Typical ROI: 14-18 month payback on $110K-$170K implementation investment
- Total benefit for 1 MW facility: $326,000/year (cost reduction + DR revenue)
- LUMA’s CBES program offers 75-125 events annually at $1-$1.25/kWh compensation rates
- Load reduction comes from non-critical systems (HVAC, lighting, equipment cycling)—never core production
- Puerto Rico’s grid crisis creates 2.7x higher savings than mainland due to elevated baseline rates
- Energy management platforms deliver DR capability plus efficiency optimization and sustainability compliance
In 2003, LEGO stood on the brink of bankruptcy. The iconic Danish toymaker had lost its way, drowning in complexity with theme parks, video games, and over 13,000 different product variations. Kids weren’t connecting with the brand anymore. The company was hemorrhaging money with $800 million in debt and no clear path forward.
Then came the radical pivot: strip everything back to basics. Focus obsessively on those simple, interlocking bricks that made LEGO legendary. Partner strategically (Star Wars, Harry Potter). Build what works, eliminate what doesn’t. Within five years, LEGO went from bankruptcy to becoming the world’s most valuable toy brand all by rediscovering that sometimes the most powerful solutions aren’t new and complex, but simple and strategic.
Puerto Rico’s manufacturers face a similar moment of truth. But instead of bankruptcy from product complexity, they’re bleeding from energy costs that are 173% higher than the US mainland. The conventional wisdom says this is just the price of doing business in paradise. Accept it. Absorb it. Or leave.
Smart manufacturers are discovering a different playbook, one that turns the island’s biggest operational liability into a revenue-generating asset. They’re getting paid $1.00 to $1.25 per kilowatt-hour by grid operators while simultaneously cutting peak electricity costs by 14-35%. It’s not about adding complexity. It’s about strategically leveraging what you already have: flexible production schedules, existing equipment, and the island’s desperate need for grid stability.
Welcome to demand response, where Puerto Rico’s energy crisis becomes your competitive advantage.
The $2 Million Energy Tax Puerto Rico Manufacturers Didn’t Vote For
Every month, Puerto Rico manufacturers write checks that would make their mainland competitors wince. Industrial electricity costs 24.22 cents per kilowatt-hour compared to just 8.86 cents on the mainland, a staggering 173% premium. For a mid-sized facility consuming 8,760 megawatt-hours annually, that’s an extra $1.5 to $2 million bleeding straight from the bottom line.
But here’s where it gets worse. This isn’t a temporary spike, it’s the new normal. Puerto Rico relies on 62% petroleum-fired generation, making electricity costs hostage to volatile international oil prices. When crude oil jumps, so does your production cost. When competitors on the mainland enjoy stable natural gas pricing, you’re stuck explaining to your CFO why energy represents 25-35% of total production costs instead of the industry-standard 15%.
The pharmaceutical giant with four mainland plants and one in Puerto Rico? That Puerto Rico facility operates with an automatic disadvantage before producing a single pill. The medical device manufacturer competing for contracts? They’re losing bids to mainland competitors who simply have lower structural costs.
And Then There’s the Grid Reliability Problem
High costs are only half the nightmare. Hurricane Maria in 2017 destroyed Puerto Rico’s transmission infrastructure. The 2020 earthquakes damaged the island’s two largest power plants. The result? A grid that hiccups, sputters, and occasionally goes completely dark.
When grid operators face generation shortfalls, which happened over 47 days in 2023, someone’s production line goes dark. That’s $50,000 to $2 million per hour in lost production, not counting damaged equipment from power surges or missed customer delivery deadlines.
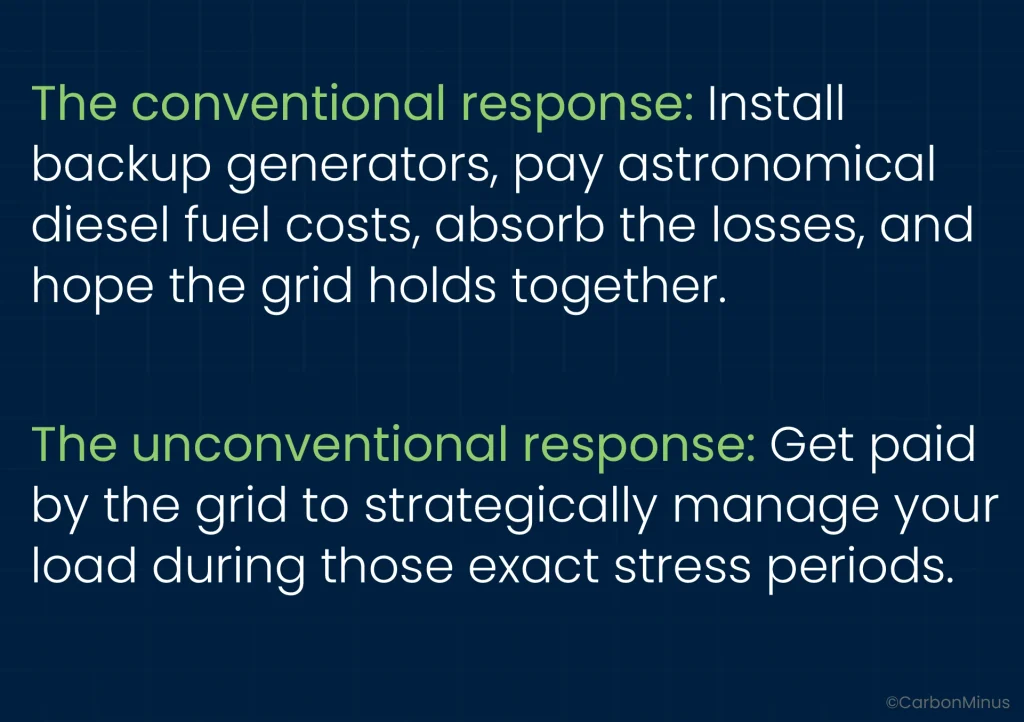
The Double-Win Solution Hiding in Plain Sight
Demand response sounds complicated, but the concept is disarmingly simple: reduce your electricity consumption during grid stress periods, and grid operators pay you for it.
You’re not shutting down production. You’re not sacrificing output. You’re strategically timing energy-intensive processes to avoid the grid’s weakest moments and collecting checks for your cooperation.
Here’s the financial equation that’s making CFOs in Puerto Rico sit up and take notice:
Win #1: Cost Avoidance
- Peak demand charge reductions: 14-35% achievable
- Time-of-use optimization: Additional 2.3-3.4% cost savings
- Energy efficiency gains: 2.8-4.7% consumption reduction
Win #2: Revenue Generation
- LUMA’s CBES Program: $1.00-$1.25/kWh during events
- Tesla VPP Program: $1.00/kWh payment rate
- Frequency: 75-125 dispatch events expected annually
- Duration: 2-hour average per event
How This Actually Works (Without Stopping Your Production Line)
The genius of automated demand response isn’t what you sacrifice, it’s what you keep. Cleveland-Cliffs reduces 50% of its peak load without affecting steel production quality or schedules. Kimberly-Clark shuts down its 5.3 MW tissue machine during events but continues packaging operations using in-process inventory, earning payments while performing scheduled maintenance.
The secret? Four strategic load reduction approaches that don’t touch your critical processes.
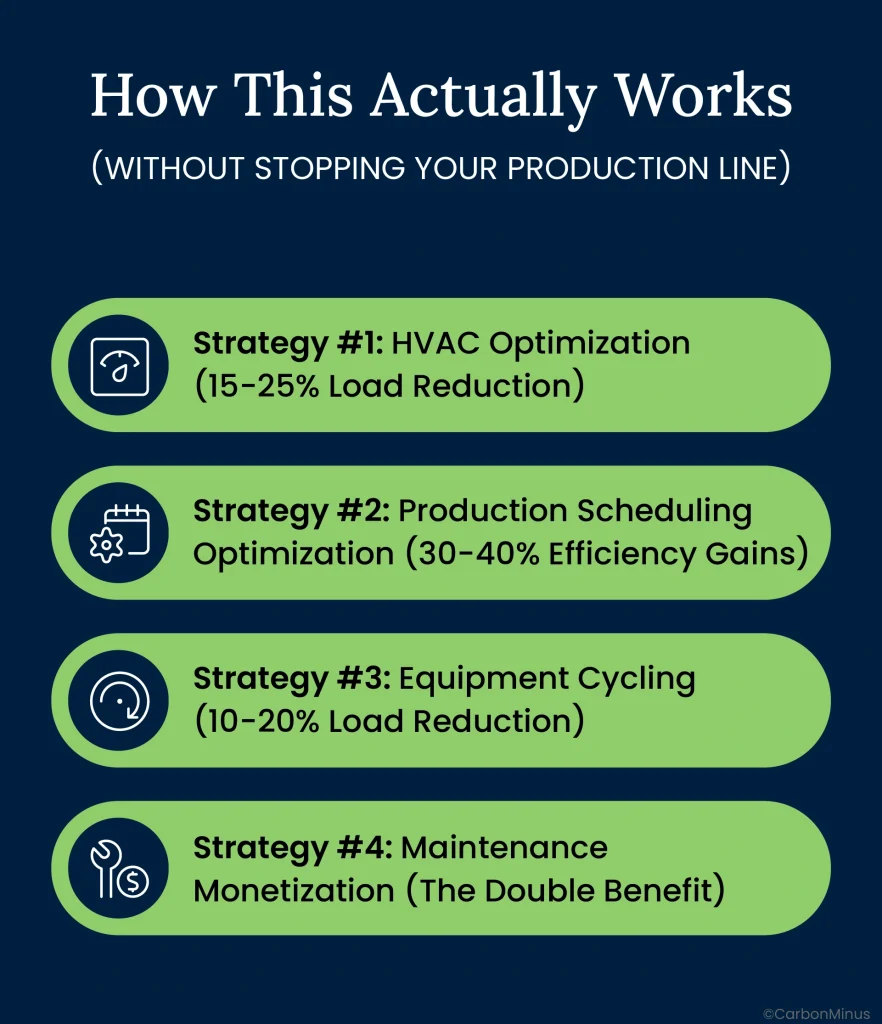
Strategy #1: HVAC Optimization (15-25% Load Reduction)
Your facility’s air handling systems are massive energy consumers and they’re surprisingly flexible.
The playbook:
- Pre-cool facilities 2-3 hours before anticipated grid events using weather forecasting
- Increase setpoints by 5°F during 2-hour event windows
- Reduce ventilation to code-minimum in non-critical zones
- Temporarily disable cooling in warehousing areas
Real impact: A pharmaceutical facility in Puerto Rico reduced 18% of its peak load through HVAC optimization alone without a single production interruption. Employees noticed zero comfort difference during the 2-hour windows.
Strategy #2: Production Scheduling Optimization (30-40% Efficiency Gains)
This is where the magic happens. Demand response events are predictable—grid stress typically occurs during afternoon peak hours (2 PM-6 PM) on hot summer days. Armed with advance notice, you strategically time energy-intensive processes around these windows.
The playbook:
- Shift grinding, mixing, and high-heat processes to 10 PM-6 AM windows
- Batch processing during low-rate periods to maximize throughput
- Front-load energy-intensive work earlier in the day
- Use demand response events for scheduled maintenance activities
Real impact: Manufacturers implementing demand-responsive scheduling report 30-40% operational efficiency improvements. Not just energy savings, but better labor utilization, reduced overtime costs, and optimized asset deployment.
Strategy #3: Equipment Cycling (10-20% Load Reduction)
Your facility runs dozens of systems that don’t need to operate continuously.
The playbook:
- Stage compressor operation to maintain pressure with fewer units
- Cycle conveyor belts during low-throughput periods
- Reduce lighting in unoccupied areas to emergency levels
- Temporarily shutdown non-critical auxiliary equipment
Critical rule: Never touch mission-critical production equipment. The goal is surgical precision—cutting 200-500 kilowatts here and there across multiple systems, not blunt-force shutdowns that risk quality or safety.
Strategy #4: Maintenance Monetization (The Double Benefit)
Every facility has scheduled maintenance like equipment inspections, calibrations, cleaning cycles that require temporary shutdowns.
The breakthrough insight: Time these activities to coincide with demand response events, and you get paid for maintenance you were going to perform anyway.
Real impact: Kimberly-Clark’s tissue manufacturing facility earns capacity payments while conducting scheduled maintenance during events, turning a cost center into a revenue opportunity. They shut down production for 4 hours, perform maintenance, process inventory, and collect demand response payments simultaneously.
The Technology That Makes It Work (While You Sleep)
Manual demand response is a non-starter for manufacturers. You can’t have an engineer watching weather forecasts, monitoring grid conditions, and manually adjusting dozens of systems in real-time. The response window is 10 minutes or less from utility dispatch signal to load reduction.
That’s where automated demand response (ADR) technology transforms this from theoretical to turnkey.
How ADR Works in Practice
Step 1: Real-Time Monitoring (24/7 Vigilance)
- Continuous tracking of energy consumption across all systems
- Peak demand forecasting and alerts
- Baseline establishment for performance measurement
- Predictive analytics for grid stress period anticipation
Step 2: Automated Event Response (10-Minute Execution)
- Utility sends dispatch signal via OpenADR 2.0 protocol
- ADR system receives signal, validates authenticity
- Pre-programmed load reduction sequence executes automatically
- Critical equipment protection protocols engage
- Zero manual intervention required
Step 3: Performance Validation & Reporting
- Real-time tracking of kilowatt-hour reduction
- Automated reporting to utility and aggregator
- Financial benefit calculation
- Continuous optimization based on results
What Gets Integrated
Modern ADR platforms don’t replace your existing systems, they orchestrate them.
System Integration:
- Building Management Systems (BMS): HVAC, lighting, facility controls
- SCADA Systems: Industrial process monitoring and control
- ERP Systems: Production scheduling coordination
- Weather APIs: Predictive event preparation
- Utility Communication: OpenADR 2.0 standard compliance
The beauty? Everything you already own gets smarter, not replaced. Your existing meters, sensors, PLCs, and control systems suddenly communicate, coordinate, and optimize around grid conditions automatically.
The Proof: Real Manufacturers, Real Money
Demand response isn’t theoretical, it’s printing money for manufacturers right now. Let’s examine three case studies spanning different industries and load profiles.
Cleveland-Cliffs Steel: $500K-$1M Annual Revenue
Profile: Integrated steel manufacturer with blast furnaces, rolling mills, and high-energy operations
The Challenge:
Steel production is energy-intensive and traditionally inflexible. Blast furnaces run continuously at 2,000°F+. Any production interruption risks product quality and equipment damage.
The DR Strategy:
- Target: 50% peak demand reduction during events
- Approach #1: Eliminate/reduce major auxiliary energy users (ventilation, conveyors, non-critical lighting)
- Approach #2: Ramp up on-site generation capacity (blast furnace gas recapture)
- Predictive capability: Weather tracking to anticipate events and schedule accordingly
The Results:
- Annual revenue: $500,000 to $1,000,000 from DR program alone
- Production impact: Zero compromise to steel quality or delivery schedules
- Duration: Multi-year consistent performance
- CFO quote: We’re making more money from energy flexibility than many of our operational efficiency initiatives
The lesson: Even “inflexible” continuous processes have surprising load reduction capacity when you focus on auxiliary systems and on-site generation.
Kimberly-Clark Paper Products: 5.3 MW Capacity Payments
Profile: Tissue paper manufacturing with energy-intensive drying processes
The Challenge:
Paper machines consume massive electricity for drying and processing. Tissue production seems like the last place you’d find energy flexibility.
The DR Strategy:
- Capacity: 5.3 MW load reduction (complete tissue machine shutdown)
- Duration: 4-hour DR events
- Production continuity: Continue packaging operations using in-process inventory
- Maintenance alignment: Perform scheduled maintenance during events
The Results:
- Double benefit: Earn DR payments while conducting necessary equipment maintenance
- Product quality: Zero impact on tissue quality or customer deliveries
- Scalability: Successfully replicated program in multiple global facilities
- Operations quote: “We discovered our maintenance windows could be revenue opportunities, not just cost centers”
The lesson: Strategic inventory management + maintenance scheduling = demand response revenue without production sacrifice.
Uddeholm Steel (Sweden): 13 MW from High-Heat Furnaces
Profile: Specialty steel manufacturer with high-temperature heat treatment processes
The Challenge:
Steel heat treatment requires precise temperature control. Any variation risks metallurgical properties and product specifications.
The DR Strategy:
- Capacity: 13 MW from furnace operations
- Revenue model: Capacity payments for availability (not just performance)
- Growth trajectory: Started 0.9 MW (2021), expanded to 13 MW (2024)
The Results:
- Process impact: Zero effect on steel quality or production schedules
- Financial model: Ongoing capacity payments without production disruption
- Operational insight: Even ultra-sensitive high-heat processes can participate
- Scaling success: 14x capacity increase in 3 years
The lesson: The most “sensitive” processes can participate once you understand the true flexibility windows in your operations.
Lineage Cold Storage (Australia): Zero Temperature Impact
Profile: Temperature-controlled cold storage facility (product quality depends on consistent temps)
The Challenge:
Cold storage can’t compromise temperatures without risking product spoilage worth millions. Yet refrigeration is the facility’s largest energy consumer.
The DR Strategy:
- Capacity: 3,250 kW load reduction
- Dual programs: 4-minute frequency response + 2-hour peak reduction
- Technology: Leverage thermal mass of cold storage as built-in flexibility
The Results:
- Revenue impact: 5% of electricity cost increases offset by DR revenue
- Temperature integrity: Zero product temperature variations or quality issues
- Event reliability: Consistent performance across multiple events
- Insurance for clients: Demonstrated temperature control even during DR participation
The lesson: ven facilities with zero tolerance for operational variation can participate through smart technology and thermal mass management. Integrating thermal energy storage into these systems helps stabilize demand, smooth out fluctuations, and maintain consistent performance without disrupting production.
Why Puerto Rico Manufacturers Have a Unique Advantage
Puerto Rico’s energy crisis isn’t just a cost problem, it’s an arbitrage opportunity. The same factors that make energy expensive create disproportionate financial rewards for those who can provide flexibility.
The Math of Higher Baselines
Mainland manufacturer (8.86¢/kWh baseline):
- 35% peak reduction = 3.1¢/kWh saved
- 1 MW facility = $40,734 annual savings
Puerto Rico manufacturer (24.22¢/kWh baseline):
- 35% peak reduction = 8.5¢/kWh saved
- 1 MW facility = $111,690 annual savings
- Advantage: 2.7x greater absolute savings
For the same technical effort and the same load reduction percentage, Puerto Rico manufacturers capture 2.7 times more value — even before factoring in demand response revenue payments. Programs under Puerto Rico microgrid funding have amplified these returns, enabling manufacturers to turn energy efficiency into a profitable resilience strategy.
Three Revenue Streams Mainland Facilities Can’t Access
Stream #1: Peak Demand Charge Avoidance
Peak demand charges represent 30-70% of Puerto Rico electric bills due to generation scarcity. Reduce your peak by 25%, and you’re cutting the single largest line item on your utility invoice.
Stream #2: LUMA CBES Program Payments
- Rate: $1.00-$1.25/kWh for load reduction
- Frequency: 75-125 events annually
- Duration: 2-hour average
- Scale: Industrial participation research underway (currently residential focus)
Stream #3: Virtual Power Plant (VPP) Compensation
- Tesla VPP: $1.00/kWh payment rate
- Earning potential: Up to $1,000/year per battery unit at residential scale
- Industrial scale: Exponentially larger capacity = proportionally larger payments
Example calculation (1 MW facility, conservative assumptions):
- 100 DR events/year (within 75-125 range)
- 250 kW average load reduction during events
- 2-hour average duration
- Total annual reduction: 50 MWh
- DR revenue at $1.00/kWh: $50,000
- Peak cost avoidance (25%): $212,161
- Energy efficiency savings (3%): $63,648
- Total annual benefit: $325,809
ROI: With $110,000-$170,000 implementation investment, payback is 14-18 months.
The Resilience Premium (Unquantifiable But Real)
When the grid fails—and in Puerto Rico, it does—manufacturers with energy flexibility keep operating while competitors go dark. That’s not just avoiding lost production costs (\$50K-\$2M per hour). That’s capturing market share, fulfilling customer commitments, and building a reputation for reliability that competitors can’t match.
In paradise, energy independence isn’t just a cost optimization, it’s a competitive moat.
Your 90-Day Roadmap from Assessment to Revenue
Demand response implementation isn’t a multi-year transformation project. With modern automation platforms, you can move from initial assessment to earning first payments in under 90 days. Here’s the proven roadmap.
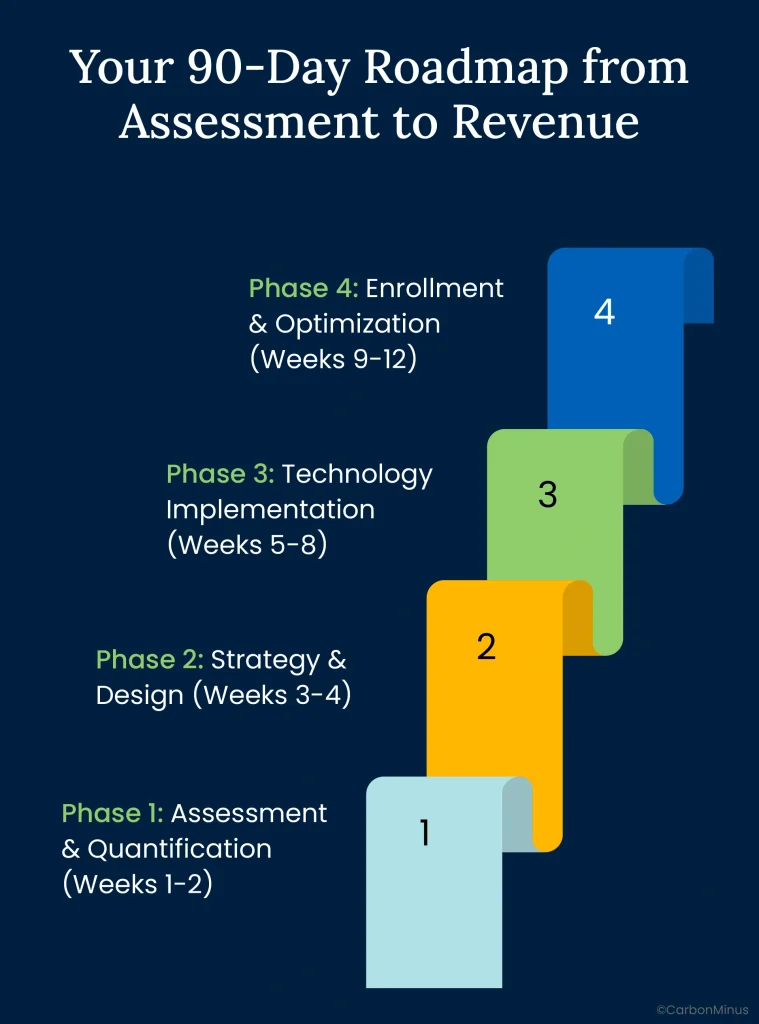
Phase 1: Assessment & Quantification (Weeks 1-2)
Objective: Understand your facility’s specific DR opportunity and ROI
Activities:
- Baseline energy audit: Map consumption patterns across equipment and processes
- Peak demand analysis: Identify when and where you consume most electricity
- Flexibility assessment: Determine which loads can be curtailed without production impact
- Technology gap analysis: Evaluate existing monitoring, automation readiness
- Financial modeling: Calculate cost avoidance + DR revenue potential
Deliverable: Business case document with:
- Projected 14-35% peak reduction potential
- Estimated annual DR revenue (\$1-$1.25/kWh × events)[4][5
- Technology investment requirements
- 14-18 month ROI projection
Cost: Often no-cost assessment through energy management platform vendors or utility programs.
Phase 2: Strategy & Design (Weeks 3-4)
Objective: Design your facility-specific DR approach
Activities:
- Program selection: Choose LUMA CBES, VPP, or multiple programs
- Load reduction protocol design: Define equipment-by-equipment response sequences
- Production continuity planning: Establish critical equipment protection protocols
- Maintenance alignment strategy: Map maintenance windows to DR event profiles
- Technology architecture: Design monitoring and control system integration
Deliverable: DR Operations Manual with:
- Automated response sequences by equipment
- Production safeguard protocols
- Staff roles and escalation procedures
- Performance targets and KPIs
Duration: 2 weeks for straightforward facilities, 4 weeks for complex multi-process operations.
Phase 3: Technology Implementation (Weeks 5-8)
Objective: Deploy monitoring, control, and automation infrastructure
Activities:
- Hardware installation: Deploy energy meters, sensors, control devices (if needed)
- Software integration: Connect ADR platform with existing BMS, SCADA, ERP
- Automated sequence programming: Configure load reduction protocols
- OpenADR setup: Establish utility communication for event signals
- Testing: Run simulated events to validate response sequences
Deliverable: Fully operational ADR system with:
- Real-time energy monitoring across all systems
- Automated 10-minute response capability
- Utility communication verified
- Performance reporting dashboard
Investment: $80,000-$120,000 for monitoring/control systems, $30,000-$50,000 for installation/integration (total $110,000-$170,000).
Phase 4: Enrollment & Optimization (Weeks 9-12)
Objective: Enroll in DR programs and optimize performance
Activities:
- Program enrollment: Complete LUMA CBES and/or VPP applications
- Aggregator selection: Choose and contract with DR aggregator (if required)
- Staff training: Educate operations team on DR protocols
- First test event: Participate in initial event, measure performance
- Performance refinement: Adjust automation parameters based on results
Deliverable: Active program participation with:
- First DR revenue check received
- Measured load reduction validated
- Peak demand cost reductions visible on utility bill
- Optimization roadmap for ongoing improvement
First-year results: $100,000-$500,000 additional revenue potential based on facility size and participation level.
The ROI That Makes CFOs Say “Yes”
Let’s make this concrete with a real-world Puerto Rico scenario.
Example Facility: 1 MW Peak Demand Manufacturing Plant
Current Annual Energy Costs (Baseline):
- Average consumption: 8,760 MWh/year
- Peak period consumption (15% of hours): 1,314 MWh
- Industrial rate: 24.22¢/kWh
- Total annual energy cost: $2,121,612
- Demand charges (40% of bill): $848,645
With Demand Response Implementation
Cost Reductions:
- Peak demand reduction: 25% (conservative estimate)
- Demand charge savings: $212,161 annually (25% of $848,645)
- Energy efficiency improvement: 3% through optimized scheduling
- Energy cost savings: $63,648 (3% of $2,121,612)
- Total annual cost avoidance: $275,809
Revenue Generation:
- DR events per year: 100 (conservative, within 75-125 range)
- Average load reduction during events: 250 kW
- Event duration: 2 hours average
- Total annual energy dispatched: 50 MWh (250 kW × 2 hrs × 100 events)
- Compensation rate: $1.00/kWh (conservative)
- Annual DR revenue: $50,000
Total Annual Financial Benefit: $325,809
Implementation Investment:
- Monitoring & control system: $80,000-$120,000
- Installation & integration: $30,000-$50,000
- Total investment: $110,000-$170,000
Return on Investment:
- Payback period: 14-18 months
- Year 1 net benefit: $155,809-$215,809
- 10-year net benefit: $3,088,090 (assuming flat rates)
- 20-year net benefit: $6,346,180
ROI percentage: 192-296% in first year alone
What Your CFO Wants to Hear
“We’re proposing a $140,000 investment that delivers $325,000 in year-one benefits, a 232% return. Payback is 15 months. By year three, we’ll have generated nearly $1 million in combined savings and revenue. And unlike most capital projects, these benefits compound annually with zero ongoing capital requirements.
Plus, we’re building energy resilience that protects us during the next grid emergency when we’ll operate and our competitors won’t.”
The Objections You’re Already Thinking (And Why They’re Wrong)
Let’s address the elephants in the room, the reasons manufacturers hesitate on demand response. Every objection below is real, common, and solvable.
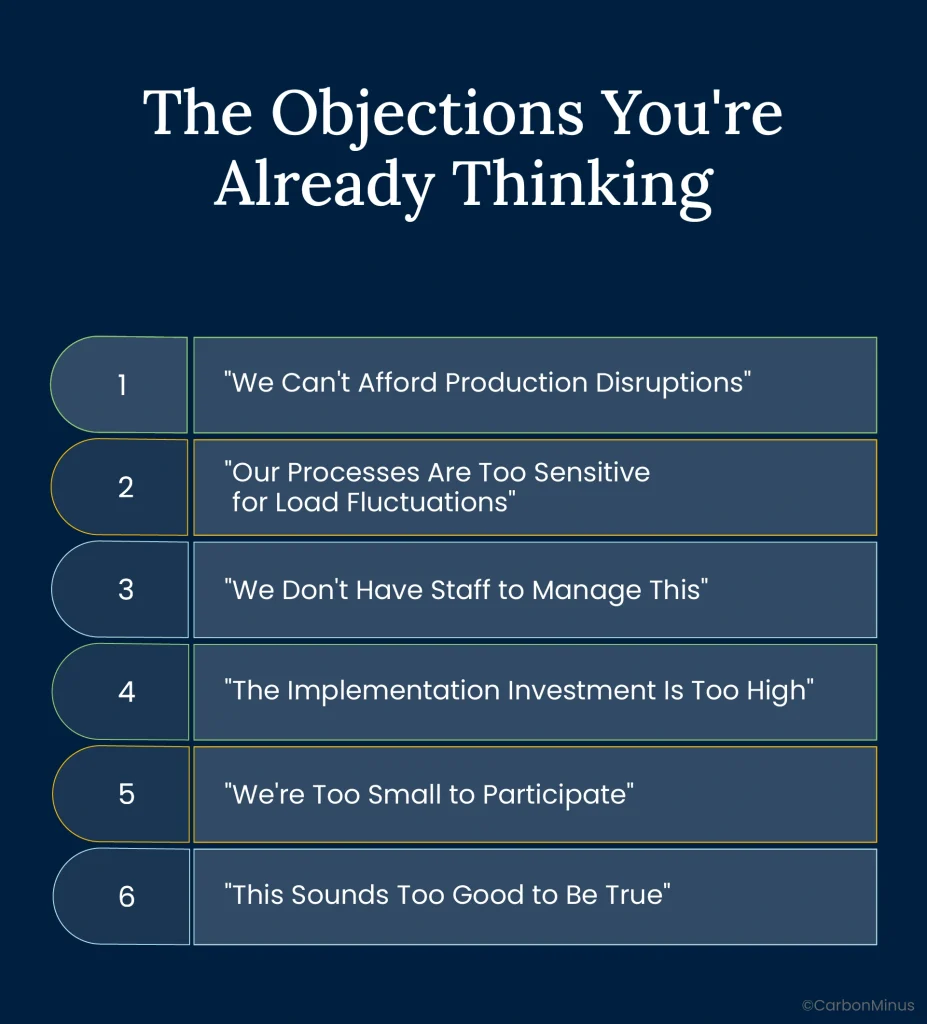
Objection #1: “We Can’t Afford Production Disruptions”
What you’re thinking:
Our production line runs 24/7. Any disruption costs us $100K+ per hour. Demand response sounds like voluntary shutdowns.
The reality:
Cleveland-Cliffs reduces 50% of peak load without touching steel production. Kimberly-Clark continues packaging during tissue machine shutdowns. Uddeholm maintains steel quality across 13 MW of load reduction.
The breakthrough: You’re not shutting down production—you’re strategically managing non-critical auxiliary systems (HVAC, compressed air, conveyors, lighting) and timing energy-intensive processes around 2-hour windows.
Your critical equipment never gets touched. Automated systems include production continuity safeguards that prioritize quality and safety above all DR payments.
Objection #2: “Our Processes Are Too Sensitive for Load Fluctuations”
What you’re thinking:
We’re pharmaceuticals/semiconductors/medical devices. Temperature, humidity, and power quality variations risk entire batches worth millions.
The reality:
Lineage cold storage facilities participate in DR with zero temperature impact. Pharmaceutical facilities have successfully implemented DR by pre-cooling before events and using thermal mass.
Modern ADR systems execute load reductions with surgical precision. They don’t cause power quality issues or voltage fluctuations, they smoothly ramp down non-critical systems while maintaining rock-solid power to sensitive equipment.
Critical process protection is the first design principle, not an afterthought.
Objection #3: “We Don’t Have Staff to Manage This”
What you’re thinking:
My operations team is stretched thin. They’re not going to manually monitor grid conditions and adjust equipment 100 times per year.
The reality:
That’s exactly what automation solves. Once configured, ADR systems operate completely autonomously:
- Receive utility dispatch signals automatically
- Execute pre-programmed load reduction sequences
- Validate performance and report results
- Calculate financial benefits
- Zero ongoing manual intervention required
You don’t need new staff. The system runs itself while you sleep. Your operations team only reviews quarterly performance reports—not managing daily events.
Objection #4: “The Implementation Investment Is Too High”
What you’re thinking:
$140,000 for energy management systems? Our CapEx budget is frozen.
The reality:
14-18 month payback. That’s faster ROI than most production equipment investments. And Puerto Rico’s high electricity rates accelerate payback by 2.7x compared to mainland.
Plus, many utility programs offer incentives that offset 30-50% of implementation costs. Some aggregators provide turnkey installations with revenue-sharing models that require zero upfront capital.
The real question: Can you afford to keep paying $2M+ extra in energy costs annually when a $140K investment eliminates it?
Objection #5: “We’re Too Small to Participate”
What you’re thinking:
These programs are for massive steel mills and refineries. We’re only 500 kW peak demand.
The reality:
LUMA’s CBES program targets 19,500 participants, most of them small residential and commercial customers. Battery storage qualifies at residential scale with earning potential of $1,000/year per unit.
If homeowners with single battery units can participate profitably, industrial facilities of any size can absolutely benefit. Many aggregators specialize in pooling small loads to meet program minimums, you participate as part of a larger portfolio.
Your 500 kW reduction is exactly the type of flexible load grid operators desperately need.
Objection #6: “This Sounds Too Good to Be True”
What you’re thinking:
35% cost reduction + earning $1/kWh + 15-month payback? There must be a catch.
The reality:
The only “catch” is that Puerto Rico’s energy crisis creates extraordinary arbitrage opportunities. Grid operators face generation shortfalls 47+ days per year. They’re desperate for flexible load that can reduce demand during stress periods.
Your flexibility is more valuable in Puerto Rico than anywhere on the mainland because the grid is more fragile. That’s why compensation rates are higher, savings are larger, and ROI is faster.
The numbers seem too good because Puerto Rico’s problem is that severe. Smart manufacturers are capitalizing on crisis-level compensation rates before the grid stabilizes and rates normalize.
Why CarbonMinus Makes This Turnkey (Instead of a Multi-Vendor Nightmare)
Most manufacturers exploring demand response hit the same wall: system fragmentation.
Your energy meters come from one vendor. Your SCADA system from another. Building management from a third. Production scheduling from a fourth. The utility uses OpenADR 2.0 for communication. Your DR aggregator needs hourly performance data. Your CFO wants ROI tracking.
Traditional approach: Hire an energy consultant (\$50K-\$150K), pay for a one-time audit, then you’re on your own to integrate everything. Result? Projects stall, systems don’t talk, staff gets overwhelmed, and DR participation never happens.
The Integration Problem That Kills DR Projects
What fails:
- Energy consultants provide audits, not ongoing optimization
- SCADA upgrades show data but don’t automate response
- Manual participation can’t meet 10-minute response requirements
- Fragmented systems require dedicated staff to coordinate
- No integration with production scheduling creates conflicts
What manufacturers actually need:
- Automated 10-minute event response without manual intervention
- Integration with existing BMS, SCADA, ERP systems
- Real-time monitoring + predictive analytics
- OpenADR 2.0 utility communication
- Performance tracking and financial reporting
- Production continuity safeguards
- Continuous AI-driven optimization
How CarbonMinus Delivers the Complete Stack
Hardware-Agnostic Integration
Connects with any existing equipment like meters, sensors, PLCs, SCADA systems, regardless of manufacturer. No need to replace infrastructure. Your current systems suddenly communicate and coordinate automatically.
Real-Time Energy Intelligence
- 24/7 consumption monitoring across all systems
- Peak demand forecasting and alerts
- Baseline establishment for DR performance measurement
- Energy efficiency opportunity identification
Production System Integration
- Coordination with manufacturing execution systems
- Maintenance schedule alignment with DR events
- Equipment health monitoring and predictive maintenance
- Production continuity safeguards
Compliance & Reporting Bonus
Since you’re already deploying an energy management platform:
- ISO 50001 energy management certification
- GHG emissions tracking (Scope 1, 2, 3)
- Sustainability reporting for ESG disclosures
- Regulatory compliance automation
The Single Platform Advantage
Instead of coordinating five vendors, paying five contracts, and hoping systems integrate, CarbonMinus is the unified backbone that makes everything work together.
Turn Paradise’s Energy Crisis Into Your Competitive Advantage
Puerto Rico manufacturers face a choice at this exact moment.
Option A: Accept the Energy Tax
Keep paying 173% more than mainland competitors. Absorb $1.5-$2M in extra annual costs. Hope the grid holds together. Cross your fingers during summer peak periods. Watch margins erode while CFOs question the viability of Puerto Rico operations.
Option B: Flip the Script
Cut peak electricity costs by 14-35%. Earn $1.00-$1.25/kWh from grid operators during stress periods. Generate $100K-$500K in annual DR revenue. Operate during grid emergencies when competitors go dark. Turn energy from your biggest cost liability into a profit center.
The manufacturers who will win in Puerto Rico aren’t those with the lowest base costs, they’re those who turn disadvantages into strategic assets.
What Happens Next Depends on What You Do Monday Morning
If you do nothing:
- Next 6 months: Continue bleeding $750K-$1M in excess energy costs
- Next 12 months: Miss 75-125 DR events worth $50-$250K in payments
- Next 24 months: Fall further behind competitors who’ve already implemented DR
- Next 3 years: Watch corporate question Puerto Rico facility viability as mainland plants show superior margins
If you take action:
- Week 1: Schedule no-cost DR opportunity assessment
- Month 1: Present business case to CFO with 15-month ROI projection
- Month 2: Deploy automated DR system, enroll in LUMA CBES
- Month 3: Participate in first events, receive first payment checks
- Year 1: Generate $325K+ in combined savings and revenue
- Year 3: Become internal champion, present at industry conferences, get promoted
The Window Is Now
Puerto Rico’s grid crisis creates unprecedented compensation rates for demand response. As the grid stabilizes (new generation, transmission upgrades, renewable integration), these rates will normalize.
Five years from now, every manufacturer in Puerto Rico will have demand response capability. The question is whether you’ll be the innovator who built it first or the follower playing catch-up.
FAQs
How much can my facility realistically earn from demand response?
Earnings depend on your load reduction capacity and event frequency. Cleveland-Cliffs Steel earns $500,000-$1,000,000 annually from their DR program. For a typical 1 MW Puerto Rico manufacturing facility, you can expect:
- Peak cost avoidance: $212,000/year (25% demand charge reduction)
- DR event payments: $50,000/year (100 events × 250 kW × 2 hours × $1/kWh)
- Energy efficiency gains: $64,000/year (3% consumption improvement)
- Total annual benefit: $326,000
With implementation costs of $110,000-$170,000, payback is 14-18 months.
Will this disrupt my production or affect product quality?
No. Cleveland-Cliffs reduces 50% of peak load with zero compromise to steel quality or delivery schedules. Kimberly-Clark shuts down 5.3 MW during events while continuing packaging operations with zero impact on product quality.
Load reduction comes from non-critical systems (HVAC, lighting, auxiliary equipment), never your core production processes. Automated systems include safeguards that prioritize production over DR payments if any critical threshold is breached, full power is automatically restored.
What’s the typical ROI and how fast is payback?
ROI: 14-18 month payback period
Investment: $110,000-$170,000 (monitoring systems + installation)
First-year benefit: $200,000-$500,000 (depending on facility size)
10-year net benefit: $3+ million for a 1 MW facility
Puerto Rico manufacturers achieve 2.7x faster ROI than mainland facilities due to 173% higher baseline electricity rates. The same technical effort yields much greater absolute savings.
Do I need to invest in new equipment or can I use existing systems?
Most facilities leverage existing equipment with minimal additions. Modern platforms like CarbonMinus are hardware-agnostic and integrate with any existing meters, BMS, SCADA, or control systems regardless of manufacturer.
You’re not replacing infrastructure, you’re adding intelligence that makes existing systems coordinate automatically. Hardware additions typically represent only 20-30% of project cost; the majority is software integration and configuration.
How quickly must I respond when a demand response event is called?
10 minutes from utility signal to measurable load reduction. This is why automated demand response (ADR) technology is essential, manual response takes 30-60 minutes and can’t guarantee compliance.
Once configured, ADR systems receive utility signals via OpenADR 2.0 protocol and execute pre-programmed sequences automatically with zero manual intervention required. You’re not personally responding to events; the system handles everything autonomously.
What demand response programs are available in Puerto Rico?
LUMA’s Customer Battery Energy Sharing (CBES) Program:
- Compensation: $1.00-$1.25/kWh for load reduction
- Target: 40 MW capacity from 19,500 participants
- Events: 75-125 annually, averaging 2 hours each
- Status: Permanent program (transitioned from pilot in 2024)
Virtual Power Plant (VPP) Programs:
- Tesla VPP: $1.00/kWh payment rate
- Other aggregators: Sunnova, Sunrun, Fortress Power
Industrial facilities can participate in either or both programs simultaneously.
What size facility is needed to participate?
There’s no fixed minimum. LUMA’s CBES program targets 19,500 participants, including residential customers earning up to $1,000 annually. If homeowners can participate profitably, industrial facilities of virtually any size qualify.
Facilities with 500+ kW peak demand are ideal for standalone participation. Smaller facilities can join through aggregators who pool multiple loads to meet program minimums.
Will this affect my staff workload?
Daily: Zero hours. Automated systems handle all event participation without manual intervention.
Monthly: 1-2 hours reviewing performance dashboards and financial reports.
Total annual commitment: 20-30 hours (less than 1 hour per week).
Once configured, ADR systems operate autonomously, monitoring grid conditions 24/7, receiving dispatch signals, executing load reductions, and generating compliance reports while your team focuses on production.
What happens if I can’t participate in a specific event?
No penalties in most voluntary DR programs. You simply don’t receive payment for that event. Your future participation and program eligibility remain unaffected.
The system includes override capabilities, if production requires full power during any event, you maintain complete control to prioritize operations over DR payments.
Why are Puerto Rico’s DR rates higher than the mainland?
Puerto Rico’s energy crisis creates scarcity economics. With 62% petroleum-dependent generation, aging infrastructure, and limited interconnection, the grid faces generation shortfalls 47+ days per year. When blackouts threaten, paying manufacturers $1.00-$1.25/kWh for load reduction is far cheaper than rolling blackouts costing the economy $50M+ daily.
Mainland states with robust generation pay $0.10-$0.30/kWh. Puerto Rico’s isolation makes flexible load 5-10x more valuable. This creates a limited-time opportunity—as the grid modernizes, rates will normalize. Manufacturers implementing DR now lock in crisis-level compensation.