Key Takeaways
- Equipment failures cost US manufacturing $50 billion annually, with automotive facilities losing $2-2.3 million per hour of unplanned downtime
- 40% of manufacturers have zero real-time visibility into equipment health, discovering failures only after production stops
- Real-time asset monitoring detects failures 2-4 weeks in advance, reducing unplanned downtime by 35-45% and cutting maintenance costs by 25-30%
- Emergency repairs cost 3-5 times more than planned maintenance, yet most facilities still operate reactively
- Predictive maintenance delivers 10x average ROI with positive returns within 12-18 months
- Failing equipment consumes 20-50% more energy, connecting asset performance directly to carbon emissions and ESG compliance
In a laboratory at the University of Southern California, scientists made a startling discovery: mice were performing first aid on unconscious companions. Without any training, healthy mice detected distress signals in drugged cage-mates, sniffing, pawing, even pulling open their mouths to clear airways. These tiny creatures, with brains a fraction of ours, instinctively knew when something was wrong and took immediate action to prevent catastrophe.
Meanwhile, 40% of US manufacturers have zero real-time visibility into their equipment health. They find out about failures after production stops. Emergency repairs cost 3-5x more than planned maintenance. And $50 billion hemorrhages from the industry annually.
If mice can predict and respond to distress signals before it’s too late, why can’t your factory?
The $50 Billion Crisis Hiding in Plain Sight
The numbers tell a story most operations leaders already know in their gut but haven’t quantified. US manufacturing loses $50 billion every year to equipment failures. That’s not a theoretical risk,it’s money actively leaking from balance sheets while production seems normal on the surface.
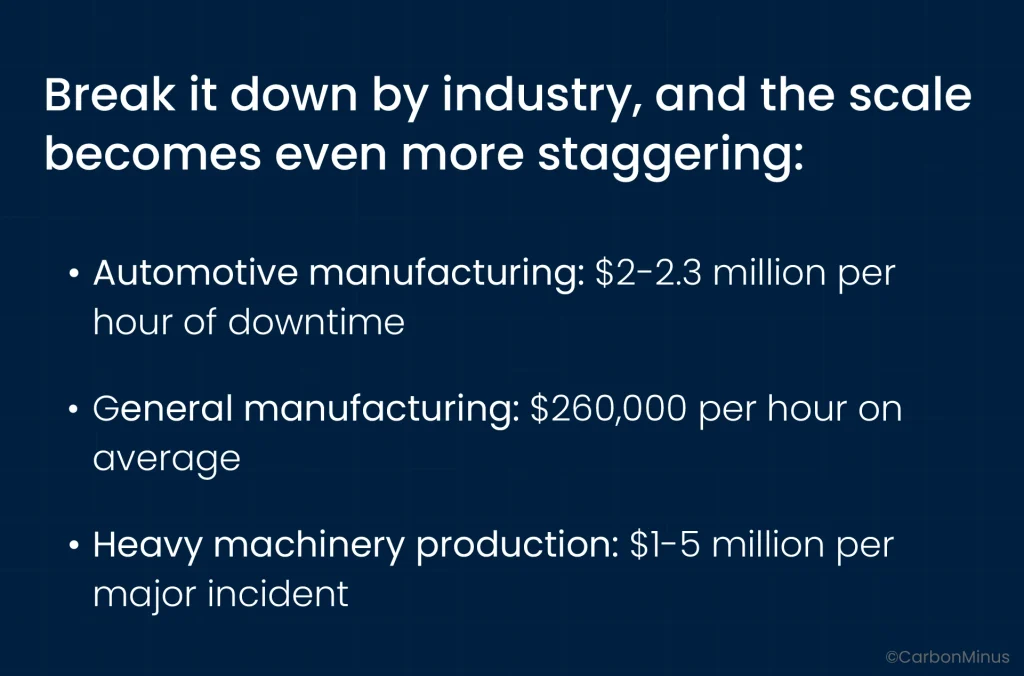
The average manufacturing facility experiences 20 unplanned downtime incidents per month, that’s one catastrophic interruption every business day. Over a year, that compounds to approximately 800 hours of lost production. For an automotive plant running at $2.3 million per hour, that’s $1.84 billion in annual losses from a single facility.
Suppose, your production line goes dark at 2 AM on a Tuesday. By the time you get a technician on-site, diagnose the transformer issue, and source emergency parts, you’ve lost 9 hours of production and $2.3 million. The CEO asks how you didn’t see it coming. You have no answer.
But here’s what makes this crisis particularly insidious: 56% of manufacturers only identify equipment problems after they occur. They’re not managing assets, they’re performing industrial triage.
The Visibility Gap: Flying Blind at 600 MPH
The root of the $50 billion problem isn’t a lack of technology, it’s a crisis of visibility. Consider the bogong moth: despite a brain smaller than a grain of rice, these Australian insects navigate 600+ miles using stellar compass navigation, detecting microscopic shifts in star patterns to guide their journey perfectly. They use available data to make life-or-death decisions with zero margin for error.
Now consider this: 40% of manufacturing operations have zero real-time visibility into equipment status. The data exists in temperature sensors, vibration monitors, power meters, but it’s trapped in siloed systems that never communicate. Maintenance logs sit in one database, production metrics in another, and sensor data in a third. When a critical asset fails, operations teams scramble to piece together what happened from three disconnected sources.

The five critical gaps manufacturers miss:
1. Behavioral Inertia: The “Fix It When It Breaks” Mindset
Loss aversion is a powerful psychological force: humans prefer avoiding losses over acquiring equivalent gains. In manufacturing, this manifests as reactive maintenance which is the instinct to preserve capital by deferring monitoring system investments until after a catastrophic failure forces the issue. The irony? Emergency repairs cost 3-5 times more than planned maintenance, making the “wait and see” approach the most expensive option.
2. The Sensor Paradox: Data Rich, Insight Poor
Most facilities already have sensors on critical equipment, they’ve simply never aggregated or analyzed the data. Temperature readings, vibration patterns, and power consumption fluctuations generate thousands of data points daily, but without AI-driven pattern recognition, these signals remain invisible to human operators. It’s like having smoke detectors that record data but never sound the alarm.
3. Ignoring Real-World Context
Equipment doesn’t fail in a vacuum and environmental factors like dust accumulation, heat exposure, humidity levels, and even operator behavior patterns affect performance. Yet traditional maintenance schedules ignore these variables, relying instead on arbitrary time intervals that have no correlation to actual equipment wear. A machine running in extreme heat deteriorates faster than one in controlled conditions, but time-based maintenance treats them identically.
4. Disconnected Data Ecosystems
Maintenance records and live machine data exist in parallel universes. When technicians fix a recurring issue, that tribal knowledge stays in logbooks or their heads, never feeding back into predictive models that could prevent the next occurrence. This information gap forces every facility to relearn the same expensive lessons.
5. Fixed Schedules vs. Actual Usage Patterns
Time-based maintenance assumes equipment degrades linearly, but reality is far more complex. A pump running 24/7 under heavy load will fail faster than one operating intermittently at low capacity, yet both follow the same maintenance calendar. This mismatch leads to two outcomes: premature maintenance (wasting labor and parts) or delayed maintenance (risking catastrophic failure).
The Hidden Cost Cascade You’re Not Tracking
Downtime costs are just the tip of the iceberg. The real financial hemorrhage happens in cascading consequences most CFOs never see on P&L statements.
Energy Waste: The Invisible Drain
Failing equipment consumes 20-50% more energy than optimally functioning assets. A motor with worn bearings works harder to maintain output, drawing excess power that shows up as unexplained utility cost increases. Across a facility with 100 motors, pumps, and compressors operating near failure, that compounds into millions in wasted energy annually.
An Indian cement plant discovered their air compressors were consuming 163,320 kWh more than baseline due to degraded performance which is equivalent to $16,332 in unnecessary annual costs from just three pieces of equipment. Multiply that across every aging asset, and the scale becomes staggering.
Quality Degradation: The Reputation Tax
Equipment operating near failure doesn’t just stop, it produces defective output first. Misaligned cutting tools create tolerance issues. Temperature fluctuations in chemical reactors yield inconsistent batches. Worn injection molds produce parts that fail quality control.
The financial impact extends beyond scrap costs: customer returns, warranty claims, and reputation damage with key accounts. One defective batch shipped to an automotive OEM can result in production line shutdowns at their facility and losing that contract permanently.
Supply Chain Disruption: The Domino Effect
When your production stops unexpectedly, delays cascade to customers who’ve committed to their own downstream partners. Just-in-time manufacturing amplifies this effect: a 9-hour delay at your facility creates a 36-hour delay for your customer who now misses their shipping window.
The cost isn’t just the immediate order, it’s the premium freight charges to recover timelines, the penalty clauses in supply contracts, and the erosion of trust that makes customers diversify to competitors “just to be safe”.
The Labor Cost Multiplier
Emergency repairs trigger cost explosions across multiple vectors:
- Overtime labor at 1.5-2x standard rates for round-the-clock repair crews
- Emergency contractor rates charging 3-4x normal fees for immediate availability
- Expedited parts shipping via air freight instead of standard ground
- Lost productivity from pulling production staff off normal duties to assist with troubleshooting
A planned bearing replacement during scheduled downtime costs $2,500. The same repair as an emergency at 2 AM costs $12,000, nearly 5x more for identical work.
Shortened Equipment Lifespan
Reactive maintenance can reduce asset lifespan by 30% compared to predictive approaches. Running equipment to failure creates secondary damage: a seized bearing damages the shaft, which requires motor replacement, which necessitates coupling and alignment work. What could have been a $500 bearing swap becomes a $50,000 equipment overhaul.
Safety Incidents: The Unquantifiable Risk
Catastrophic equipment failures create workplace hazards, flying debris from exploding pressure vessels, chemical releases from failed seals, electrical fires from overheated transformers. Beyond human safety concerns, OSHA fines, worker’s compensation claims, and facility shutdowns during investigations compound financial losses.
How Real-Time Asset Monitoring Prevents Catastrophic Failures
If mice with tiny brains can detect distress signals and respond instinctively, modern manufacturing shouldn’t be operating blind. Real-time asset monitoring transforms equipment from black boxes into transparent, predictable systems.
The Technology Stack: From Sensors to Insights
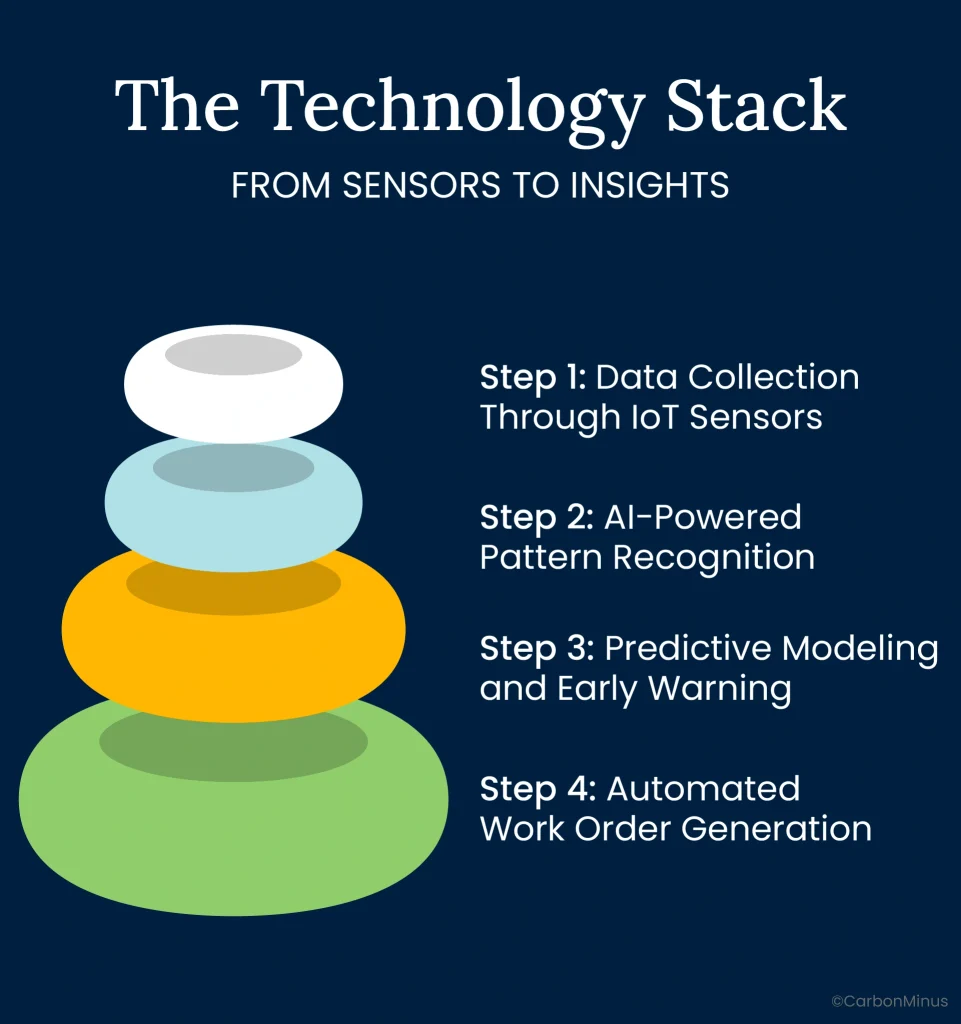
Step 1: Data Collection Through IoT Sensors
Modern monitoring systems deploy IoT sensors that track multiple equipment health indicators simultaneously:
- Vibration analysis: Detects bearing wear, misalignment, imbalance, and mechanical looseness before catastrophic failure
- Thermal imaging: Identifies hot spots indicating electrical issues, friction, or inadequate lubrication
- Acoustic monitoring: Recognizes unusual sounds,clicks, grinding, squeals,that signal developing problems
- Power consumption patterns: Flags inefficiencies showing equipment working harder than baseline performance
- Pressure and flow rates: Tracks pump and compressor degradation in real-time
These sensors continuously stream data to centralized platforms, creating a comprehensive digital twin of every asset’s operational status.
Step 2: AI-Powered Pattern Recognition
Raw sensor data is noise without context, thousands of temperature readings mean nothing without understanding normal operating ranges. This is where artificial intelligence transforms monitoring from reactive to predictive.
Machine learning algorithms establish baseline “heartbeat” patterns for each piece of equipment during the first 3-6 months of monitoring, learning what “healthy” looks like for your specific facility, operating conditions, and usage patterns. Once baseline is established, AI continuously compares live data against these patterns, flagging anomalies that indicate developing failures.
The system doesn’t just detect problems, it identifies specific failure modes: bearing degradation, electrical imbalance, seal leakage, or lubrication issues. Instead of a generic “something is wrong” alert, maintenance teams receive actionable insights: “Motor 7B bearing shows early-stage failure pattern; recommend replacement within 2 weeks”.
Step 3: Predictive Modeling and Early Warning
The breakthrough isn’t detecting failures, it’s predicting them 2-4 weeks before they occur. By analyzing the progression of anomaly patterns, AI models forecast when equipment will cross from “degraded performance” into “imminent failure”.
This advance warning transforms maintenance from emergency firefighting into strategic scheduling. Teams can:
- Order parts in advance using standard shipping (not expensive expedited freight)
- Schedule repairs during planned downtime windows (minimizing production impact)
- Allocate labor efficiently (no overtime, no emergency contractor rates)
- Coordinate with production planning to shift workloads to other lines
Step 4: Automated Work Order Generation
Leading platforms automatically generate maintenance work orders when predictive models flag impending failures. Instead of relying on plant managers to remember to follow up on alerts, the system triggers the entire workflow: parts procurement, technician scheduling, downtime coordination with production, and post-repair verification.
This automation eliminates the gap between detection and action, the window where “we’ll get to it next week” becomes “it failed overnight”.
The Numbers Don’t Lie: ROI That CFOs Love
The business case for real-time asset monitoring isn’t theoretical. It’s quantifiable, verifiable, and consistently delivers returns that make CFOs take notice.
70-75% Reduction in Equipment Breakdowns
Facilities implementing predictive maintenance experience 70-75% fewer unplanned equipment failures. That’s not an incremental improvement,it’s a fundamental transformation from reactive chaos to predictive control.
Real-world example: An automotive components manufacturer averaging 20 breakdowns per month reduced incidents to 5-6, eliminating 336 hours of annual downtime. At $2.3 million per hour, that’s $773 million in preserved production value.
35-45% Reduction in Unplanned Downtime
Even when failures do occur, real-time monitoring minimizes duration. Detailed diagnostic data eliminates troubleshooting time,technicians arrive knowing exactly what failed and which parts to bring. This cuts Mean Time To Repair (MTTR) by 35-45% compared to “diagnose on arrival” approaches.
Real-world example: A chemical processing facility reduced average repair time from 9 hours to 5 hours per incident, recouping 80 additional production hours annually per line.
25-30% Lower Annual Maintenance Costs
Predictive maintenance cuts total maintenance spending by 25-30% compared to reactive approaches. The savings come from multiple vectors:
- Eliminate 3-5x emergency repair cost premiums by planning all work in advance
- Reduce parts inventory costs by ordering only what’s needed when it’s needed
- Extend equipment lifespan 15-20% by preventing catastrophic failures that cause secondary damage
- Optimize maintenance intervals based on actual wear rather than arbitrary schedules
Real-world example: A steel manufacturer saved $1.8 million annually by transitioning from time-based to condition-based maintenance across their facility.
8-12% Energy Efficiency Gains
By identifying equipment operating below optimal efficiency, facilities achieve 8-12% energy consumption reductions. A motor with degraded bearings drawing 20% excess power gets flagged for repair before it fails, saving energy costs while extending asset life.
Real-world example: An Indian cement plant eliminated 163,320 kWh of waste from three air compressors, saving $16,332 annually just from that optimization. Scaled across all facility assets, energy savings compound rapidly.
10x Average ROI Over 3 Years
When you combine avoided downtime costs, reduced maintenance spending, energy savings, and extended equipment lifespan, predictive maintenance delivers 10x average ROI over three-year timeframes. More importantly, 73% of implementations achieve positive ROI within 12-18 months, fast enough to satisfy even conservative CFO approval hurdles.
Real-world example: A mid-sized automotive supplier invested $250,000 in real-time monitoring infrastructure. First-year savings totaled $890,000 from avoided downtime ($620,000), reduced emergency repairs ($180,000), and energy optimization ($90,000). By year three, cumulative savings exceeded $2.8 million, which is over 10x the initial investment.
Beyond Operational Efficiency: The Sustainability Advantage
Here’s where most asset monitoring discussions stop but the story doesn’t end with operational efficiency. The connection between asset performance and carbon emissions creates a dual value proposition that’s increasingly critical for manufacturers facing ESG pressures.
The Asset Performance-Carbon Emissions Link
Failing equipment doesn’t just cost money, it actively increases your carbon footprint. That motor drawing 20-50% excess power due to bearing degradation is converting electricity into wasted heat rather than productive work. Across dozens of aging assets, these inefficiencies compound into massive emissions increases.
Real-time monitoring that optimizes asset performance simultaneously drives down Scope 2 emissions (indirect emissions from purchased energy). You’re not making a tradeoff between efficiency and sustainability, they’re the same objective viewed through different lenses.
Meeting Regulatory Pressures with Automated Compliance
Manufacturers face escalating regulation: ISO 50001 (Energy Management Systems), ISO 14064 (Greenhouse Gas Accounting), PAT (Perform Achieve Trade schemes in India), and CBAM (Carbon Border Adjustment Mechanism) affecting EU exports. Compliance audits are resource-intensive nightmares when data lives in spreadsheets across multiple locations.
Real-time monitoring platforms automate this entire burden. Every sensor reading, every efficiency gain, every maintenance action gets logged automatically,creating an auditable trail that satisfies regulatory requirements without manual report compilation. What previously consumed weeks of staff time becomes a click-to-export report.
Real-world example: An Indian pharmaceutical facility facing ISO 50001 certification manually compiled reports from 47 spreadsheets over three weeks and barely passed. After implementing automated monitoring, their next audit required 2 hours of report generation, a 98% time reduction.
Investor Expectations and ESG Performance
Companies with strong ESG scores perform 50% better than peers in long-term returns. 75% of institutional investors view companies prioritizing ESG initiatives as better long-term opportunities. Poor ESG performance creates 14% lower company valuations compared to industry peers.
Real-time asset monitoring delivers quantifiable ESG wins: documented energy reductions, lower emissions intensity per unit of production, and verifiable progress toward net-zero commitments. These aren’t vague sustainability claims, they’re data-backed metrics investors can validate.
From Crisis to Competitive Advantage: The Implementation Roadmap
The gap between “this makes sense” and “we’ve implemented it” is where most transformation initiatives die. Here’s the realistic pathway from crisis to competitive advantage, including the challenges most vendors won’t mention.
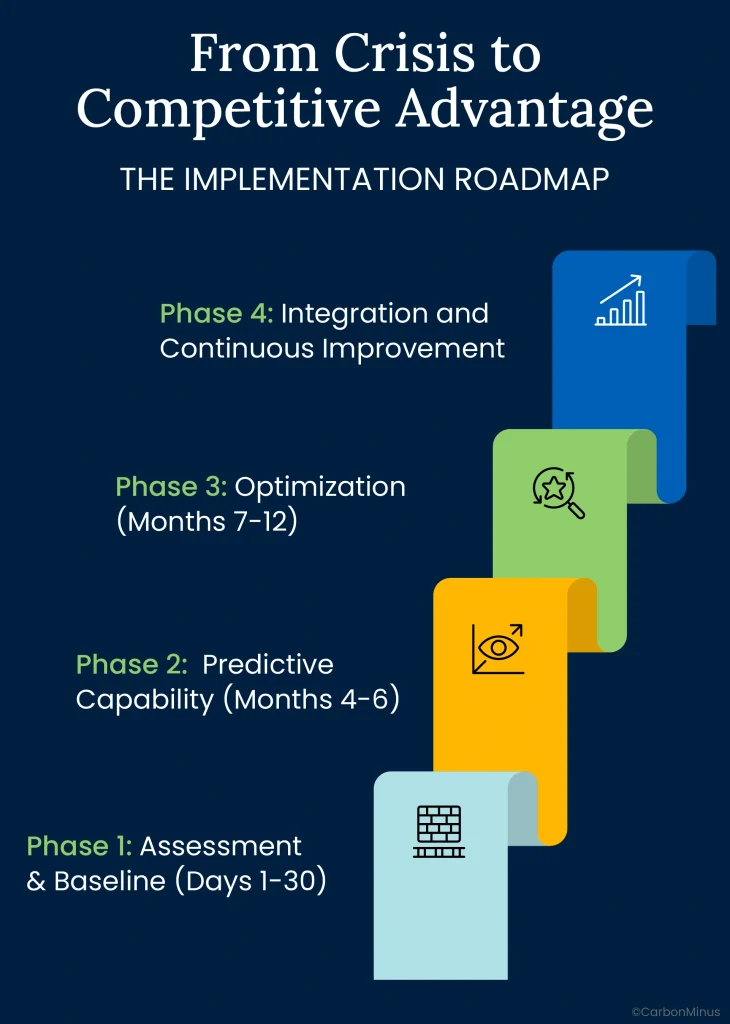
Phase 1: Foundation (Months 1-3)
The 3-6 month data preparation period is non-negotiable. AI-powered predictive maintenance requires baseline establishment,learning what “normal” looks like for your specific equipment, operating conditions, and production patterns.
Rushing this phase creates 60% false positive rates where systems cry wolf repeatedly, causing teams to ignore alerts and defeating the entire purpose. The investment here isn’t just financial, it’s patience.
What happens during baseline establishment:
- IoT sensors deployed on critical assets (pumps, motors, compressors, HVAC systems)
- Sensors begin streaming data to centralized platform
- AI algorithms learn equipment “heartbeat” patterns during normal operation
- Integration with existing maintenance management systems (CMMS) begins
- Maintenance teams receive training on platform interface and alert interpretation
Hardware agnosticism is critical here. The platform must work with your existing equipment, 1995 machinery and 2025 machinery side-by-side, without requiring wholesale replacement. This dramatically reduces capex requirements and accelerates deployment.
Phase 2: Predictive Capability (Months 4-6)
Once baseline is established, AI models begin identifying anomaly patterns and predicting failures. Early wins typically focus on highest-risk assets,those with greatest downtime costs or longest lead times for replacement parts.
First ROI milestones:
- Month 4: First prevented failure, a critical motor flagged 3 weeks before predicted breakdown, allowing planned repair during scheduled downtime
- Month 5: Energy optimization begins, identifying equipment operating inefficiently and prioritizing repairs based on consumption waste. As these inefficiencies surface, it becomes clear how the ongoing manufacturing energy crisis is pushing companies to tighten operations and eliminate preventable energy loss.
- Month 6: Maintenance budget predictability improves, shifting from emergency spending spikes to planned expenditures
Cultural challenge: Maintenance teams accustomed to reactive firefighting must adapt to proactive scheduling. Frame this transition as empowerment, not surveillance: “You’re moving from constantly reacting to crises to strategically managing assets”.
Phase 3: Optimization (Months 7-12)
With proof of concept validated on critical assets, expand monitoring across the entire facility and multiple sites. This phase captures exponential returns as the platform manages hundreds of assets simultaneously.
Advanced capabilities activated:
- Predictive maintenance scheduling optimization: AI recommends ideal timing for repairs based on production schedules, parts availability, and predicted failure timelines
- Root cause analysis: Identifying systemic issues (e.g., “all motors in Building 3 are failing prematurely due to power quality issues”)
- Performance benchmarking: Comparing asset efficiency across multiple facilities to identify best practices
- Automated procurement: Triggering parts orders when predictive models forecast needs
Phase 4: Integration and Continuous Improvement
Mature implementations integrate asset monitoring with broader operational systems,ERP, production planning, sustainability reporting, and financial forecasting.
Strategic value realization:
- Accurate CAPEX forecasting: Data-driven equipment replacement decisions instead of “it seems old, maybe we should replace it”
- ESG reporting automation: Real-time dashboards showing energy consumption, emissions intensity, and progress toward net-zero targets
- Supply chain resilience: Proactive communication with customers when predictive models indicate potential delays
- Digital twin capabilities: Virtual simulations testing maintenance strategies before implementing them
Overcoming Implementation Barriers: What You’re Really Up Against
The technical challenges of asset monitoring are solved problems,the real obstacles are organizational.
Budget Approval: Speaking CFO Language
Finance teams approve investments with clear payback timelines. Present the business case in their language:
Initial Investment: $200,000-$500,000 depending on facility size (sensors, platform licensing, integration)
Year 1 Returns:
- Avoided downtime: $600,000 (10 prevented failures × average $60,000 per incident)
- Reduced emergency repairs: $150,000 (shifting from reactive to planned maintenance)
- Energy optimization: $80,000 (8-12% consumption reduction on monitored assets)
- Total Year 1 ROI: $830,000 on $350,000 investment = 137% return
Payback period: 5-7 months
Cultural Resistance: The “This Is How We’ve Always Done It” Problem
Plant managers who’ve spent 20 years trusting their instincts resist systems that challenge their expertise. Maintenance teams fear automation threatens their jobs.
Reframe the narrative: This isn’t surveillance,it’s augmentation. Experienced technicians remain invaluable for diagnosis and repair, but now they focus on meaningful work instead of constantly fighting fires. Data empowers their expertise rather than replacing it.
Early wins matter: Identify one skeptical plant manager, prove ROI at their facility first, then let them evangelize internally. Peer validation overcomes top-down mandates.
Integration with Legacy Systems: The “Our Equipment Is Too Old” Objection
Modern IoT sensors retrofit to equipment from any era,they don’t require smart machinery. Vibration sensors attach externally to motor housings. Thermal cameras monitor equipment from meters away. Current transformers clamp around power lines without interrupting service.
Real-world proof point: Facilities with equipment dating to 1995 successfully implement predictive maintenance by adding external sensors rather than replacing machinery.
Skill Gap: “Our Team Doesn’t Know AI”
Your maintenance team doesn’t need to understand machine learning algorithms,they need to understand alerts. Modern platforms abstract complexity behind intuitive interfaces: “Motor 7B: Bearing replacement recommended within 14 days. Estimated repair time: 4 hours. Parts on hand: Yes”.
Training focuses on interpreting alerts and updating work order statuses, not data science. The AI does the hard work; your team does what they’ve always done,just proactively instead of reactively.
The Choice: Lead or Follow (But You Can’t Stand Still)
The asset performance management market is projected to grow from $24.8 billion in 2024 to $57 billion by 2030,a 12.2% compound annual growth rate. That’s not hype; it’s capital flowing toward solutions that deliver measurable returns.
Your competitors are already making this transition. The manufacturers implementing predictive maintenance now are building 10-15% operational efficiency advantages that compound quarterly. That gap doesn’t close,it widens.
Consider the alternative timeline:
Today: Continue reactive maintenance, experience 20 downtime incidents monthly, hemorrhage $260,000-$2.3 million per hour when failures occur
6 months from now: Competitors with predictive systems are winning contracts because they guarantee uptime SLAs you can’t match
12 months from now: Board asks why operational costs are 15% higher than industry benchmarks while ESG scores lag
18 months from now: Major customer shifts 30% of volume to competitor after third supply chain disruption caused by your equipment failures
24 months from now: CFO presents board analysis showing persistent underperformance vs. peers; CEO considers operational leadership changes
This isn’t fear-mongering,it’s the documented trajectory of manufacturers who delay digital transformation while competitors move forward.
The mice in that USC laboratory didn’t wait for peer-reviewed studies before responding to distress signals. They acted on available information because the cost of inaction was too high.
Your equipment is already sending distress signals. The only question is whether you’re listening.
Ready to Stop Flying Blind?
CarbonMinus delivers real-time asset monitoring that prevents catastrophic failures while simultaneously driving down energy consumption and carbon emissions. Our platform integrates with existing equipment,no wholesale replacement required,and delivers positive ROI within 12-18 months.
Calculate your hidden downtime costs and see exactly how much you’re losing to reactive maintenance. [Book a demo] or [Use our ROI calculator] to quantify the opportunity.
FAQs
1. How does predictive maintenance compare to preventive maintenance in terms of cost?
Preventive maintenance follows fixed time schedules (e.g., “change oil every 3 months”) regardless of actual equipment condition. This leads to unnecessary maintenance on healthy equipment and missed failures on degraded assets operating under heavy loads. Predictive maintenance monitors actual condition and triggers work only when needed, reducing maintenance costs by 25-30% compared to preventive approaches and 3-5x compared to reactive maintenance. The ROI comes from eliminating wasted labor on premature maintenance while preventing expensive emergency repairs.
2. Can predictive maintenance work with our legacy equipment from the 1990s?
Yes,modern IoT sensors retrofit to equipment from any era without requiring machinery replacement. Sensors attach externally to monitor vibration, temperature, acoustics, and power consumption regardless of equipment age. The platform creates digital twins of legacy assets by learning their operational patterns over 3-6 months, then predicts failures based on deviation from baseline. Facilities with equipment dating to 1995 successfully implement predictive maintenance by adding external monitoring rather than replacing machinery.
3. What’s the typical timeline from implementation to positive ROI?
3-6 months for baseline establishment (critical for accuracy), followed by 6-12 months to positive ROI for 73% of implementations. First prevented failure typically occurs in month 4-5 after baseline is complete. Full payback of initial investment averages 12-18 months, with 10x ROI over three-year timeframes. Rushing the baseline phase creates 60% false positive rates that undermine adoption.
4. How does real-time asset monitoring connect to our sustainability goals?
Failing equipment consumes 20-50% more energy than optimally functioning assets. By identifying inefficient operation before catastrophic failure, predictive maintenance simultaneously reduces downtime costs and Scope 2 emissions (indirect emissions from purchased energy). The platform automates compliance reporting for ISO 50001, ISO 14064, PAT, and CBAM regulations, eliminating weeks of manual data compilation. This creates dual value: operational efficiency AND verifiable ESG progress that satisfies investor expectations.
5. What if our maintenance team lacks technical skills to operate AI-powered systems?
Your team doesn’t need to understand machine learning,they need to interpret alerts. Modern platforms provide intuitive interfaces: “Motor 7B: Bearing replacement recommended within 14 days. Estimated repair time: 4 hours. Parts on hand: Yes”. Training focuses on alert interpretation and work order updates, not data science. The AI handles pattern recognition; your technicians do what they’ve always done (diagnosis and repair) but proactively instead of reactively. Implementation includes comprehensive training to ensure adoption success.
6. How do we justify the investment to our CFO when budgets are tight?
Present the business case in financial terms: typical facility experiencing 20 monthly downtime incidents at $260,000/hour average loses $62.4 million annually. A $300,000 monitoring system investment that prevents just 5 failures per year saves $15.6 million,a 52x return in year one. Additionally, reducing emergency repairs by shifting to planned maintenance saves 25-30% of maintenance budget ($180,000 annually for facility spending $600,000). Energy optimization adds another 8-12% savings on utility costs. Total first-year returns typically exceed $1 million on $300,000 investment,payback in 3-5 months.
7. What happens during the first 90 days of implementation?
Month 1: IoT sensors deployed on critical assets; platform integration with existing CMMS begins; maintenance team receives initial training.
Month 2: Sensors stream baseline data; AI learns equipment “heartbeat” patterns during normal operation; team familiarizes with dashboard interface.
Month 3: Baseline establishment completes; first predictive alerts begin appearing; team validates alerts against actual equipment condition to build trust.
The goal is establishing accuracy before relying on predictions,60% false positive rates occur when this phase is rushed.