Key Takeaways
- US manufacturing energy costs rose 6-7% nationally in 2025, with Southwest and California regions facing 30-35% increases,directly threatening profit margins
- Energy-efficient equipment lasts 40% longer while reducing operating costs by 15-30%, creating dual ROI that traditional analysis misses
- 40% of manufacturing energy is wasted through inefficient equipment, costing $510 for every $1,000 spent on electricity
- The new decision framework: Energy efficiency differential is now the tiebreaker in repair vs. replace calculations, not an afterthought
- Average payback for energy-efficient equipment: 18-20 months, not the 5-10 years most CFOs assume,70% of facilities report ROI above 10%
- Excessive heat causes 55% of premature equipment failures; every 10°C temperature reduction doubles electrical component lifespan
In the depths of the Pacific Ocean, researchers at the University of Hong Kong made a startling discovery: blue sharks can change color like chameleons. By adjusting microscopic crystal angles in their scales, these predators shift from vibrant blue to silver, green, and gold,a transformation previously thought impossible.
The change happens at a level invisible to the naked eye. Crystalline structures containing melanosomes and guanine crystals reorient themselves, altering how light reflects off the shark’s body. What appears as a simple color shift on the surface is actually millions of tiny structural changes happening simultaneously, each one insignificant alone but transformative in aggregate.
Meanwhile, in manufacturing facilities across the United States, an invisible transformation of equal magnitude is underway though most executives can’t see it yet.
Two manufacturers eight miles apart face the same rising energy costs. One is hemorrhaging $36,000 more annually in electricity bills than the other. The difference isn’t visible from the production floor. It’s happening at the equipment level: microscopic changes in bearing alignment, gradual increases in motor temperature, slow degradation in compressor efficiency. Like those crystalline shark scales, each small inefficiency seems insignificant. But aggregate them across dozens of aging assets, and they create a transformation that determines survival.
In 2025, as US manufacturing energy costs rise 6-7% nationally,and 30-35% in high-cost regions,the manufacturers who recognize these invisible transformations are making fundamentally different equipment decisions than those who don’t. They’re seeing what everyone else misses: that aging motor drawing 20% more power isn’t just expensive. It’s also dying 40% faster. That “perfectly functional” compressor with leaks isn’t just wasting energy. It’s destroying your competitive position at $3,900 per tiny leak, per year.
The era of Cutting energy costs and asset management as separate concerns is over. Rising energy prices aren’t just squeezing margins,they’re fundamentally changing how smart manufacturers make every equipment decision.
The New Math: When 6% Becomes 30% Overnight
The numbers landing on CFOs’ desks in 2025 tell a story most knew was coming but hoped would arrive more slowly.
Average US industrial electricity prices: 8.32 cents per kilowatt-hour in 2025, up from 8.15 cents in 2024. Commercial electricity rose 6.7% year-over-year from June 2024 to June 2025. Wholesale power prices are climbing 7% in most regions, averaging $40 per megawatt-hour.
For a facility spending $500,000 annually on energy, a 6-7% increase translates to $30,000-$35,000 in additional costs,with zero increase in production output. That’s not a rounding error. For manufacturers operating on typical 5-15% profit margins, it’s the difference between a profitable year and breaking even.
But the national average tells only half the story.
The Regional Divide
Southwest and California manufacturers are facing 30-35% wholesale price increases in 2025, driven by grid constraints, renewable energy transition costs, and surging demand from data centers. A California facility with a $1 million annual energy budget now faces $1.3 million in costs,a $300,000 hit to the bottom line.
Texas manufacturers, despite the state’s energy abundance, are experiencing similar pressure from industrial expansion and extreme weather events stressing the grid. The cheap energy that drew manufacturing to the Sunbelt is no longer cheap.
The Compounding Crisis
Energy costs aren’t peaking,they’re projected to continue rising through 2026. Electricity demand increased 3% in 2024, marking the fifth-highest rise this century, driven by data centers, manufacturing reshoring, and electrification of transportation. Supply isn’t keeping pace with demand in key manufacturing regions.
Meanwhile, manufacturers are hemorrhaging $3.2 billion annually across the sector from energy waste alone. 40% of manufacturing energy is wasted through inefficient equipment,motors with worn bearings, compressed air systems with leaks, furnaces with poor insulation. That translates to $510 wasted for every $1,000 spent on electricity.
The crisis isn’t just rising prices. It’s rising prices compounded by internal inefficiency that most manufacturers can’t even see.
Why Your Most Expensive Equipment Is Also Dying the Fastest
Here’s the connection most asset managers miss: that motor drawing 20% more power than its nameplate rating isn’t just expensive,it’s cooking itself to death from the inside.
Energy-efficient operations extend machine life by up to 40%. At the same time, they reduce energy costs by 15-30%. Traditional asset lifecycle management treats these as separate concerns. Energy-conscious asset management recognizes they’re the same thing viewed through different lenses.
The physics is straightforward: inefficient equipment generates excess heat and vibration, accelerating wear on every component. A motor operating at 85% efficiency versus 95% efficiency doesn’t just cost more to run,it experiences 3x higher bearing failure rates, requires 2x more frequent maintenance, and fails 40% earlier in its expected lifecycle.
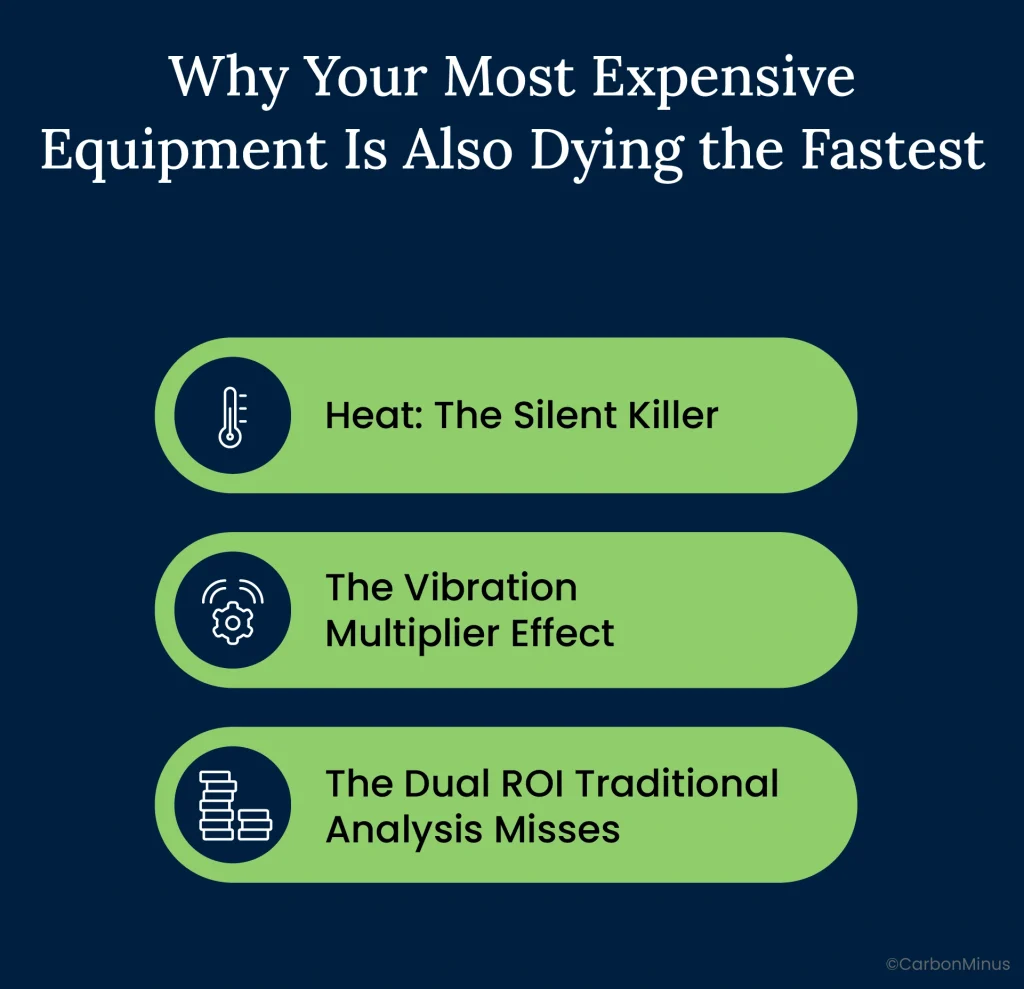
Heat: The Silent Killer
Excessive heat causes 55% of premature equipment failures. For every 10°C reduction in operating temperature, electrical component life doubles. That’s not a marginal improvement,it’s an exponential relationship.
An industrial motor designed to operate at 75°C but actually running at 90°C due to inefficiency has half its expected lifespan. Over 15 years, you’re replacing equipment twice when you should be replacing it once. The “cheap” decision to repair rather than replace becomes the expensive decision when the asset fails again three years later.
Inefficient equipment runs hotter because it’s converting excess electricity into waste heat rather than productive work. That furnace drawing 20% more power isn’t producing 20% more heat for your process,it’s producing the same useful heat plus 20% waste that’s degrading insulation, damaging control systems, and shortening refractory life.
The Vibration Multiplier Effect
Reducing vibration by 50% extends bearing life by up to 300%. Inefficient equipment runs rougher, creating excessive vibration that cascades through connected systems.
Consider a standard bearing with 20,000 hours expected life. In a high-vibration environment created by inefficient equipment, actual life drops to 6,000 hours. In a low-vibration environment maintained by efficient equipment operating at optimal parameters, the same bearing lasts 24,000+ hours.
Vibration doesn’t stay localized. That rough-running motor damages bearings, which damage shafts, which damage couplings, which affect the connected equipment. A single inefficient asset can reduce the lifespan of three other assets downstream.
The Dual ROI Traditional Analysis Misses
When you replace aging, inefficient equipment with modern, efficient equivalents, you’re not just lowering energy bills. You’re also extending the lifespan of the new asset through better operating conditions.
A $22,000 high-efficiency motor that saves $12,000 annually in energy costs has an obvious 1.83-year payback. But that same motor, operating cooler and smoother, will last 15-18 years instead of the 10-12 years you’d get from continuing to repair the inefficient predecessor. Over its lifecycle, the additional 3-6 years of operation delivers another $36,000-$72,000 in avoided replacement costs.
CFOs calculating only energy savings are missing half the value proposition.
Beyond the 50% Rule: When Energy Changes Everything
For decades, the equipment replacement decision followed a simple heuristic: if repair costs exceed 50% of replacement cost, replace the asset. Below 50%? Repair and extend the life.
That rule made sense when energy was cheap and equipment efficiency didn’t vary significantly between decades. Neither condition holds true in 2025.
Why the Old Framework Falls Short
Equipment manufactured in the 1990s and early 2000s consumes 20-30% more energy than equivalents manufactured in the 2020s. That efficiency gap compounds into massive lifecycle costs that traditional repair-versus-replace analysis ignores.
Here’s where the 50% rule breaks down: An industrial motor needs an $8,000 repair. The replacement cost is $22,000. Under the traditional framework, that’s a clear repair decision,the repair represents only 36% of replacement cost, well below the 50% threshold.
But the traditional analysis misses the critical variable: the old motor is wasting $12,000 annually in excess energy consumption compared to a modern high-efficiency equivalent. Suddenly, that “obvious” repair decision becomes an equally obvious replace decision when you factor in that the replacement pays for itself in 1.83 years through energy savings alone.
The difference between 36% and 50% doesn’t matter when the energy efficiency gap is 30%.
The Seven Variables That Actually Matter
Modern equipment decisions require a more sophisticated framework. Here are the seven variables that determine the optimal choice, ranked by financial impact:
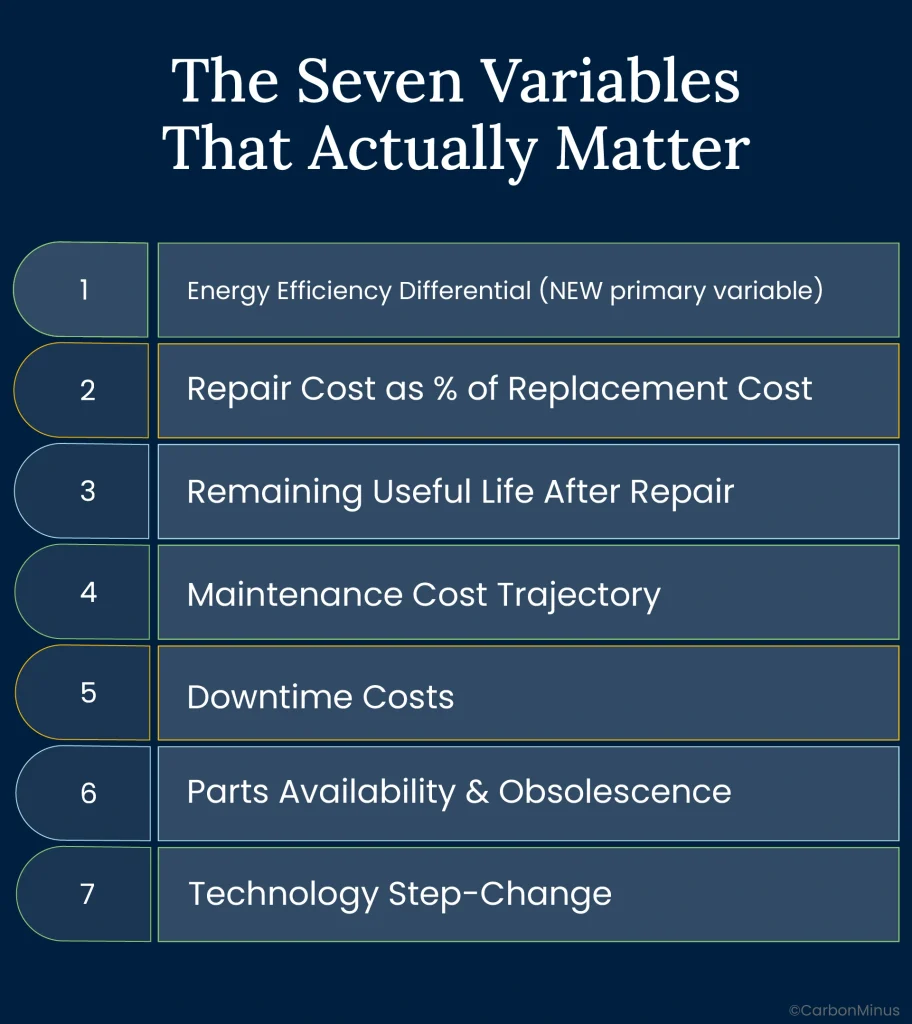
1. Energy Efficiency Differential (NEW primary variable)
Calculate current equipment energy consumption versus modern equivalent. Convert the difference into annual cost. If the equipment consumes 20-30% more energy than it should, that waste cost often exceeds annual maintenance spending.
A 100 HP motor consuming 5% over rated power wastes approximately $12,000 annually in a facility with 8.32 cents/kWh electricity costs. Over a 15-year lifespan, that’s $180,000 in unnecessary energy costs.
2. Repair Cost as % of Replacement Cost
The traditional metric still matters, but it’s no longer decisive:
- Under 30%: Strong repair candidate, unless energy inefficiency is severe
- 30-50%: Requires energy efficiency analysis,could go either way
- 50-70%: Likely replacement, especially with any energy gap
- Over 70%: Replace immediately unless replacement is imminent anyway
3. Remaining Useful Life After Repair
Will the repair genuinely extend asset life 2+ years, or is it just deferring inevitable replacement? Repairing equipment that’s 90% through its lifecycle rarely makes economic sense.
4. Maintenance Cost Trajectory
Are repair costs escalating quarterly? Is failure frequency increasing? Equipment requiring emergency repairs multiple times per year is signaling its end-of-life, regardless of what the repair-to-replacement ratio says.
5. Downtime Costs
Emergency repairs cost 3-5 times more than planned maintenance due to overtime labor, expedited parts, and production losses. Factor in the production value lost during unplanned downtime,for many manufacturers, this exceeds the repair cost itself.
6. Parts Availability & Obsolescence
Long lead times for obsolete parts increase inventory carrying costs. Discontinued parts requiring custom fabrication can cost 5-10x more than original components. When you’re paying $500 for a bearing that used to cost $50, you’re subsidizing obsolescence.
7. Technology Step-Change
Does new equipment offer 20%+ productivity improvement, smart monitoring capabilities, or dramatically better process control? Technology leaps can justify replacement even when repair costs are low.
Your Asset Decision Matrix: A Data-Driven Approach
Apply this matrix to make consistent, defensible decisions across your asset base:
| Repair/Replace Ratio | Equipment Age | Energy Efficiency Gap | Failure Frequency | Decision |
| < 30% | < 40% useful life | < 10% inefficiency | < 2 failures/year | REPAIR |
| 30-50% | 40-60% useful life | 10-20% inefficiency | 2-4 failures/year | EVALUATE |
| 50-70% | > 60% useful life | 20-30% inefficiency | 4+ failures/year | REPLACE |
| > 70% | Any age | > 30% inefficiency | Any frequency | REPLACE NOW |
How to use this framework: Score your equipment on each dimension. When factors split evenly, energy efficiency gap is the tiebreaker. A 45% repair ratio that would traditionally lean toward repair becomes a clear replacement decision when paired with 25% energy inefficiency.
When the Numbers Tell You What to Do
Theory is useful. Calculations on real equipment are better. Here are three scenarios showing when to repair, when to replace, and when to take a hybrid approach.
Scenario 1: The Forklift Transmission, Clear Repair Decision
Context:
- Electric forklift in year 12 of 15-year expected lifespan
- Transmission failure requiring rebuild
- Rebuild cost: $4,000
- New forklift: $35,000
- Energy consumption: Comparable (both electric, similar battery technology)
Analysis:
- Repair-to-replacement ratio: 11.4% (well under 30% threshold)
- Remaining useful life: 3 years
- No significant energy efficiency gain from replacement
- Annual operating costs comparable between repaired and new unit
ROI Calculation:
- $4,000 investment extends asset 3 years = $1,333 per year cost of extension
- New forklift spreads $35,000 over 15 years = $2,333 per year depreciation
- Savings from repair decision: $1,000 annually over next 3 years
Decision: REPAIR
Rationale: Low repair cost relative to replacement, significant remaining useful life, and no energy advantage to replacement make this a straightforward repair decision. The equipment still has value to deliver.
Scenario 2: The Industrial Motor, Clear Replace Decision
Context:
- 100 HP motor, 20 years old, bearing failure
- Repair (bearing replacement + rewind): $8,000
- New high-efficiency motor: $22,000
- Current motor: 91% efficiency, drawing 5% over rated power
- New motor: 96% efficiency, operating at rated power
Energy Analysis:
- Annual runtime: 6,000 hours
- Electricity cost: 8.32 cents/kWh
- Current annual energy cost: $42,000
- Excess consumption from inefficiency: $12,000/year (30% waste)
- New motor annual energy cost: $30,000
- Annual energy savings: $12,000
Traditional 50% Rule Analysis:
- Repair-to-replacement ratio: 36% (below 50% threshold)
- Traditional verdict: REPAIR
Energy-Informed Analysis:
- Energy efficiency gap: 30% (massive)
- Payback calculation: $22,000 investment / $12,000 annual savings = 1.83 years
- Additional benefit: New motor will last 15 years at high efficiency vs. repaired motor lasting 3-5 years at continued inefficiency
- Over 15-year new motor lifespan: $180,000 total energy savings minus $14,000 differential cost = $166,000 net gain
Decision: REPLACE
Rationale: The traditional 50% rule would have recommended repair, but energy efficiency differential completely changes the economics. The repair just extends inefficiency for another 3-5 years. Replacement delivers financial returns that justify the higher upfront cost within 22 months.
Lesson: Energy efficiency differential transformed a borderline repair decision into a clear replacement decision.
Scenario 3: The Compressed Air System,Repair Now, Replace Later
Context:
- Aging air compressor system with extensive leaks
- Estimated 20-30% of compressor output lost to leaks
- Single 1/8-inch leak costs $3,900 per year
- Facility has identified 8-10 significant leaks
- System-wide leak detection and repair: $2,500
- New energy-efficient compressor system: $45,000
Quick Win Analysis:
- Leak repair delivers immediate 20-30% energy reduction
- Annual savings from leak repair: $8,000-$12,000
- Payback on leak repair: 3-4 months
- New compressor offers additional 15% efficiency improvement over leak-free old system
- But $45,000 investment requires Board approval and budget availability
Decision: REPAIR NOW, PLAN REPLACEMENT LATER
Implementation Strategy:
- Month 1: Repair leaks immediately,no approval needed for $2,500 expenditure
- Months 2-6: Monitor and document energy savings from leak repair
- Month 7: Use 6 months of energy data to build business case for full compressor replacement
- Next capex cycle: Present Board with proven track record from leak repairs plus projection for full system replacement
Rationale: Don’t let perfect (full replacement) be the enemy of good (immediate efficiency gains). Quick-win leak repairs deliver 10-15x ROI while buying time to build the business case for larger replacement investment. The energy data collected during the repair phase becomes the ammunition for securing replacement approval.
Lesson: Phased approach captures immediate savings while building toward strategic replacement.
From Reactive Replacement to Strategic Optimization
Asset lifecycle management has existed for decades. Energy-conscious asset lifecycle management is the evolution required for 2025’s economic reality.
How Energy Monitoring Transforms Every Stage
Traditional asset lifecycle management follows five stages. Here’s how integrating energy efficiency reshapes each one:
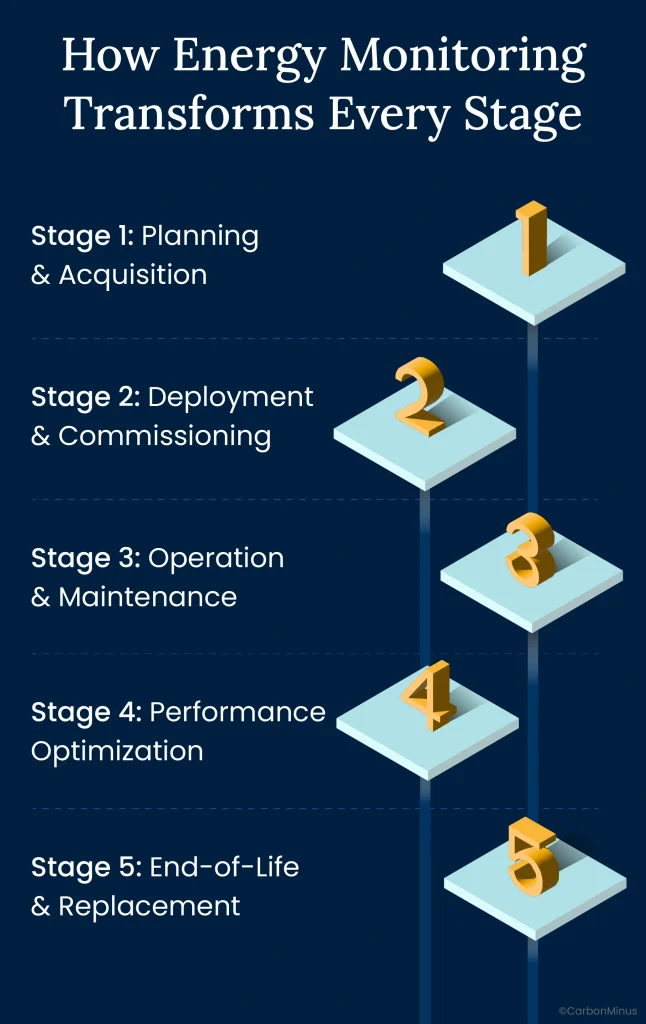
Stage 1: Planning & Acquisition
Traditional approach: Based primarily on production capacity needs and upfront cost
Energy-conscious approach: Total cost of ownership includes 15-year energy consumption projection. A $50,000 motor versus a $60,000 high-efficiency motor isn’t a $10,000 difference,it’s a $10,000 premium that pays back in 2 years via energy savings, then delivers net positive returns for the remaining 13 years.
Stage 2: Deployment & Commissioning
Traditional approach: Install equipment and start production
Energy-conscious approach: Establish energy consumption baseline and set efficiency targets during commissioning. This baseline becomes the reference point for detecting future degradation. Without a baseline, you have no way to know when equipment is consuming 20% more energy than it should.
Stage 3: Operation & Maintenance
Traditional approach: Run equipment until failure or until scheduled maintenance interval arrives
Energy-conscious approach: Continuous energy monitoring flags performance degradation months before catastrophic failure. When a motor’s power consumption increases 8% over six months, that’s bearing wear signaling impending failure. You can schedule planned maintenance before emergency repair becomes necessary.
Stage 4: Performance Optimization
Traditional approach: Focus on maximizing uptime and output
Energy-conscious approach: Optimize for efficiency throughout asset lifecycle. Implement vibration analysis, thermal imaging, and power quality monitoring to maintain peak performance. Small adjustments,alignment corrections, lubrication improvements, control system tuning,can recover 5-10% efficiency losses that developed gradually.
Stage 5: End-of-Life & Replacement
Traditional approach: Replace when repair costs exceed 50% of replacement cost
Energy-conscious approach: Replace when combined energy inefficiency + repair costs exceed replacement payback threshold. Use years of energy monitoring data to optimize replacement timing,don’t wait for catastrophic failure. Proactive replacement during planned downtime costs 3-5x less than emergency replacement.
ROI Impact from Lifecycle Management
Manufacturers implementing energy-conscious asset lifecycle management achieve quantifiable benefits:
- Reduce operational expenses by up to 15% through optimized maintenance timing
- Cut capital expenditures by up to 8% via accurate replacement forecasting that eliminates premature replacements and reduces emergency procurement
- Achieve 25% higher ROI on asset investments compared to reactive management approaches
- Extend asset lifespan 15-20% while simultaneously improving performance and efficiency
The energy integration advantage transforms asset lifecycle management from a cost-control function into a profit-optimization function.
When Your Energy Monitor Becomes Your Maintenance Scheduler
The convergence of energy monitoring and predictive maintenance creates dual-purpose infrastructure:
Energy monitoring detects: Power consumption deviations that signal equipment degradation long before visible symptoms appear
Predictive maintenance prevents: Equipment failures before they cause downtime
The dual benefit: Reduce energy waste AND prevent catastrophic failures using the same data
AI systems analyzing vibration + temperature + power consumption patterns provide 2-4 week advance warning of failures, allowing scheduled repairs during planned downtime. That same platform optimizing energy efficiency delivers 15-20% energy reduction from uptime optimization and performance tuning. One system, two critical functions, compounding ROI.
Manufacturers implementing predictive maintenance report 70-75% fewer unplanned breakdowns and 35-45% less downtime,both of which improve energy efficiency by keeping equipment operating in optimal condition.
The 18-Month Payback That Changes Board Conversations
The most persistent myth blocking energy efficiency investments is the assumption that they take 5-10 years to pay back. This belief is so widespread that CFOs reject energy projects without serious consideration, assuming the timeline doesn’t fit strategic planning horizons.
The assumption is wrong.
Busting the Payback Myth
Average payback for energy efficiency investments: 18-20 months. Not 5 years. Not 10 years. Less than two years.
70% of facilities implementing energy efficiency measures report ROI above 10%. That’s not theoretical,it’s measured, verified performance across hundreds of manufacturers.
Why does the 5-10 year myth persist? Because most analyses calculate only direct energy savings, ignoring maintenance cost reduction, extended asset lifespan, and avoided downtime. When you account for all value streams, payback timelines collapse.
Example calculation showing the full ROI picture:
- Equipment replacement investment: $100,000
- Annual energy savings: $35,000
- Maintenance cost reduction: $15,000/year (fewer emergency repairs, extended service intervals)
- Avoided downtime: $8,000/year (one prevented failure at $260,000/hour × 3 hours)
- Total annual benefit: $58,000
- Actual payback: 1.7 years (not the 5-7 years the CFO assumed calculating energy only)
The “expensive” energy efficiency investment becomes obviously profitable when all benefits are quantified.
Financial Incentives That Accelerate ROI
US manufacturers have access to federal and state programs that can reduce effective investment by 20-30%:
Federal Programs:
- Office of Energy Efficiency and Renewable Energy (EERE): Competitive grants for efficiency projects in industrial facilities
- Energy Efficiency and Conservation Loan Program: Low-interest financing specifically for industrial energy consumers
- Section 48C Tax Credits: Up to 30% tax credit for qualifying advanced manufacturing projects
- Inflation Reduction Act incentives: Additional tax credits for domestic manufacturing efficiency investments
ROI impact example:
- Project cost: $100,000
- 30% Section 48C tax credit: $30,000 reduction
- Effective investment after tax credit: $70,000
- Annual benefit (from previous example): $58,000
- Payback with incentives: 1.2 years (down from 1.7 years without)
State-level programs vary by location but often stack with federal incentives. Manufacturers in high-energy-cost states (California, New York, Massachusetts) typically have additional rebates and financing options. Check your state energy office and utility company for local programs.
The Competitive Urgency Argument
Frame the capex decision not as “should we invest in efficiency?” but as “can we afford to fall further behind competitors who already have?”
Manufacturers implementing energy-conscious asset management are building 15-20% operational cost advantages that compound quarterly. Every quarter your facility delays = another quarter your competitors gain margin they can use to underbid you by 3-5% while maintaining profitability.
Calculate the competitive disadvantage: If a competitor reduces energy costs by 20% through efficient assets and you don’t, they can offer customers 3-5% better pricing while maintaining the same margins. In price-competitive industries, that 3-5% difference determines who wins contracts.
The 90-Day Path to Smarter Asset Decisions
Implementation doesn’t require 18-month enterprise system deployments or $5 million infrastructure overhauls. Here’s a pragmatic 90-day roadmap that delivers measurable results at each phase.
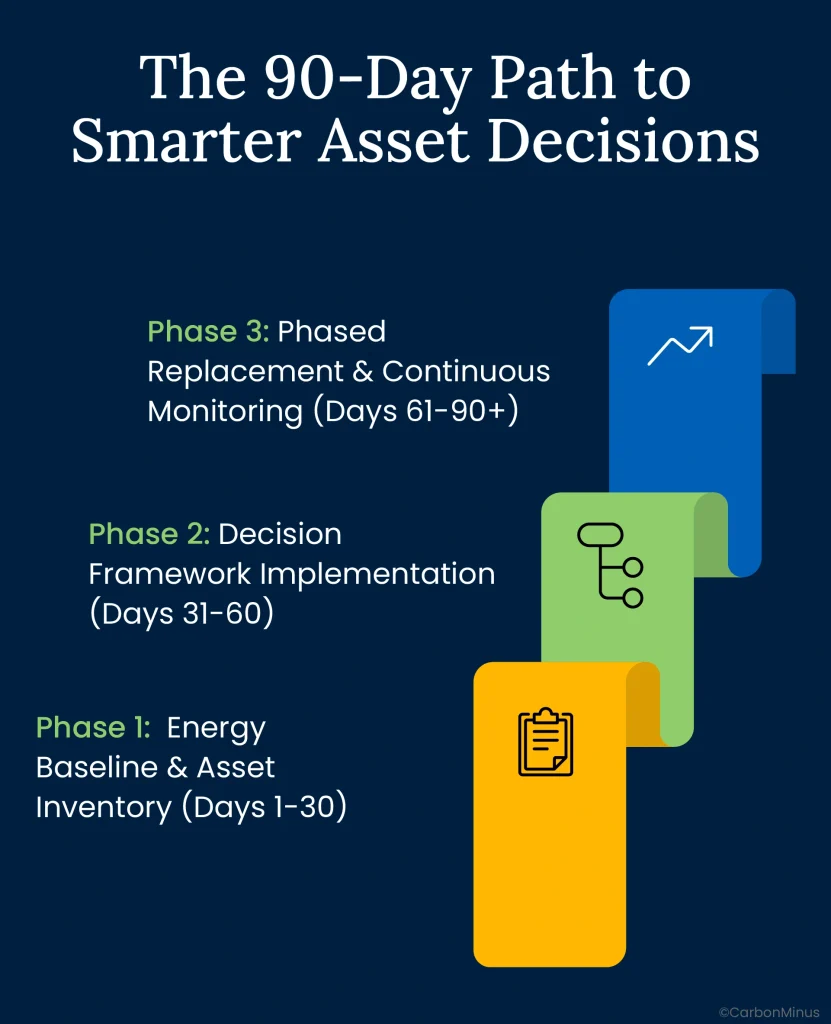
Phase 1: Energy Baseline & Asset Inventory (Days 1-30)
Deploy real-time energy monitoring on the 20 highest-energy-consuming assets in your facility. In most manufacturing plants, 20% of equipment accounts for 80% of total energy consumption,start there.
Why real-time monitoring beats traditional audits: Manual walk-through audits deliver approximately 5% energy savings. Real-time monitoring systems identify 20% savings opportunities,a 4x improvement. The difference? Continuous data captures intermittent issues, seasonal variations, and degradation patterns that snapshot audits miss.
Create a comprehensive asset inventory documenting age, condition, maintenance history, and baseline energy consumption for each critical asset. This becomes your decision-making foundation.
Identify your energy hogs: Which equipment is consuming disproportionate power relative to its function? A motor drawing 30% more power than its nameplate rating signals bearing wear, misalignment, or other efficiency-robbing conditions.
Deliverable: Prioritized replacement list ranking assets by combined energy waste + failure risk. This list drives capex allocation for the next 18 months.
Phase 2: Decision Framework Implementation (Days 31-60)
Apply the repair vs. replace matrix to your top 20 energy-wasting assets. For each asset, calculate:
- Repair-to-replacement ratio (if repair were needed today)
- Energy efficiency gap compared to modern equivalent
- Annual energy waste cost in dollars
- Complete ROI including energy savings + maintenance reduction + downtime avoidance
Run scenarios for each asset: repair vs. replace vs. optimize existing equipment. Some assets will be clear replacement candidates (high energy waste + frequent failures). Others warrant quick efficiency improvements (leak repairs, controls optimization) before considering replacement.
Secure financing and incentive applications for approved replacements. Start Section 48C tax credit applications and explore state/utility rebate programs. These programs have application timelines,start early.
Implement quick wins immediately: Low-cost fixes like compressed air leak repairs, controls optimization, and insulation improvements often deliver 10-15x ROI with 3-6 month paybacks. These wins generate early momentum and credibility for larger investments.
Deliverable: 18-month asset replacement roadmap with detailed business case (ROI, payback, risk analysis) for each major item. This becomes your Board presentation.
Phase 3: Phased Replacement & Continuous Monitoring (Days 61-90+)
Month 3: Replace highest-impact assets,those with worst energy efficiency combined with highest criticality to production. These deliver maximum financial return and operational improvement.
Months 4-6: Address mid-tier assets showing degradation in energy monitoring data. Don’t wait for catastrophic failure,proactive replacement during planned downtime costs 3-5x less than emergency replacement.
Months 7-12: Shift from reactive replacement to predictive replacement based on continuous energy + condition monitoring. Let data determine optimal timing rather than arbitrary schedules or emergency failures.
Technology integration for long-term optimization:
- IoT sensors on all critical assets providing real-time performance data
- Predictive analytics forecasting optimal replacement timing 2-4 weeks before failure
- CMMS integration creating unified view of asset condition, energy performance, and maintenance history
- Automated alerts triggering work orders when assets deviate from baseline efficiency
Deliverable: Proactive asset management system that prevents failures while continuously optimizing energy use. You’ve transitioned from reactive firefighting to strategic asset optimization.
The Choice Gets Clearer Every Quarter
Energy costs aren’t peaking,they’re projected to rise another 7% in 2026, continuing the upward trajectory. Manufacturing margins are already compressed to 5-15%, leaving little room for absorbing cost increases. The gap between energy-optimized facilities and reactive facilities represents a 15-20% operational cost differential that grows each quarter.
That gap doesn’t close. It widens.
Consider the timeline:
Today: Energy-conscious manufacturers systematically building efficiency advantages while competitors repair aging equipment
6 months from now: Cost differential becomes visible in contract bidding,competitors consistently underbid by 3-5% while maintaining margins
12 months from now: Board questions why your operational costs exceed industry benchmarks by 15%
18 months from now: Premium customers diversify to more reliable, cost-competitive suppliers who’ve invested in efficient infrastructure
This isn’t about sustainability compliance or environmental stewardship, though those are valuable co-benefits. This is about operational survival in an environment where energy costs keep rising and competitors are capturing permanent cost advantages.
Asset decisions aren’t just about keeping equipment running anymore,they’re about maintaining competitiveness through efficiency. Equipment that was “good enough” in 2020 is a financial liability in 2025. The companies recognizing this reality now are building the margin advantages that will define market leadership for the next decade.
Stop Guessing, Start Optimizing
CarbonMinus delivers real-time energy monitoring integrated with asset lifecycle management, showing exactly which equipment is wasting money and guiding every repair-versus-replace decision with data. Our platform works with existing equipment,no $5 million infrastructure replacement required,and delivers measurable ROI within 18-20 months.
Calculate your hidden energy waste and see which assets should be replaced versus repaired. [ROI Calculator] or [Book a Demo] to transform your energy crisis into competitive advantage.
FAQs
How do I know if my equipment’s energy inefficiency justifies replacement?
Compare current energy consumption to manufacturer specifications for a new equivalent model. If the gap exceeds 20%, calculate annual waste cost by multiplying excess consumption by your electricity rate. Run a payback calculation: (Replacement cost – Repair cost) divided by (Annual energy savings + Maintenance cost reduction). If payback is under 3 years, replacement is typically justified. Use real-time monitoring data to get accurate current consumption,don’t rely on nameplate ratings for aging equipment.
What if we can’t afford to replace everything at once?
Start with a phased approach prioritizing by impact: highest energy waste + most critical to production = first to replace. Implement quick wins first,leak repairs, controls optimization, and efficiency tuning often deliver 10-15x ROI with 3-6 month paybacks. Use savings from early replacements to fund subsequent investments. Explore financing options: EERE loans, Section 48C tax credits (up to 30%), and state rebates can reduce upfront burden by 20-30%. Many manufacturers implement 18-24 month replacement roadmaps rather than trying to do everything simultaneously.
How accurate are energy monitoring systems compared to traditional audits?
Real-time monitoring systems deliver 4x better results,typically identifying 20% savings opportunities versus 5% from manual walk-through audits. Continuous data collection reveals patterns that snapshot audits miss: intermittent issues, seasonal variations, equipment degradation over time, and operational inefficiencies that only appear under specific production conditions. Baseline establishment enables ongoing degradation detection,you’ll know when a motor starts consuming 8% more power over six months, signaling bearing wear. ROI on monitoring systems typically achieves payback in 6-12 months through identified savings.
Can we implement this with our existing CMMS?
Yes,modern energy monitoring platforms integrate with existing CMMS systems (Maximo, SAP PM, Fiix, UpKeep, etc.). Integration creates a unified view combining asset condition + energy performance + maintenance history in one dashboard. Some CMMS vendors are adding native energy management modules, while standalone energy platforms offer API connections to existing systems. The goal is one platform for all asset decisions, not separate siloed systems requiring manual data reconciliation. Implementation typically takes 2-4 weeks for data integration after initial sensor deployment.
What about equipment that’s old but still runs fine?
“Runs fine” doesn’t mean “runs efficiently”,equipment can operate while consuming 20-30% excess energy that you can’t see without monitoring. Calculate total lifecycle cost: (Purchase price / Expected lifespan) + (Annual energy cost × Lifespan). Often the “expensive new equipment” is dramatically cheaper over its lifecycle than “cheap to keep running old equipment”. Example: A $20,000 motor lasting 15 years at $30,000/year energy = $470,000 total cost. A $15,000 motor lasting 10 years at $42,000/year energy = $435,000 total cost. The “expensive” new motor actually costs $35,000 less over its lifecycle.
How do we get buy-in from plant managers resistant to change?
Start with a pilot at one facility, prove ROI with measurable results, then scale to other locations. Frame the initiative as empowerment, not surveillance: “Data helps you make better capital decisions and justify budget requests”. Show peer examples from similar companies: “Competitor achieved 18% cost reduction using this approach”. Let early wins create believers,when the first energy-efficient replacement prevents a failure or saves $12,000 annually, skeptics become advocates. Involve plant managers in asset prioritization decisions rather than dictating from corporate. Most resistance stems from fear of top-down mandates; collaborative implementation builds ownership.
What’s the first step to implementing energy-conscious asset management?
Deploy real-time energy monitoring on your 20 highest-consumption assets,these typically represent 80% of total energy use. Establish a 30-day baseline to understand the current state before making decisions. Identify your top 5 energy-wasting assets and run repair vs. replace analysis using the decision matrix. While baseline is established, implement immediate quick wins like compressed air leak repairs and controls optimization,these deliver results in 3-4 months while you build the business case for major replacements. The energy data you collect during this phase becomes the foundation for your capex request to the CFO and Board.