TL;DR
- Foundry scrap metal contains three revenue streams worth $1.4M+ annually that most operations ignore.
- POSCO increased scrap usage from 15% to 50%, cutting CO2 intensity from 2.1 to 2.03 tons per ton of crude steel.
- Like Fred Smith saving FedEx by turning $5,000 into $27,000 at Vegas blackjack tables in 1973, circular metallurgy transforms “waste” into strategic assets.
- The voluntary carbon credit market reached $4.04 billion in 2024 and will hit $23.99 billion by 2030.
- For a 10,000-ton steel foundry, verified circular metallurgy delivers $280K-$560K in carbon credits.
June 21, 2025, marked the passing of Fred Smith at age 80—the founder who saved FedEx from bankruptcy with a desperate bet at Las Vegas blackjack tables in 1973.
The story has become a business legend, but the details matter for foundry managers facing impossible decisions right now.
Smith’s company was days from collapse. The fuel bill—roughly $24,000—was due, and FedEx’s bank account held exactly $5,000. Banks had rejected every loan request. Investors had lost faith. Employees were waiting for paychecks that couldn’t clear.
Most executives would’ve filed for bankruptcy protection and walked away. Smith flew to Las Vegas with the company’s last $5,000 and sat down at the blackjack tables.
He walked out with $27,000.
That $27,000 kept FedEx’s planes fueled for exactly one more week—long enough to secure additional financing and build what would become a $71 billion global logistics empire.
The lesson isn’t that desperate gambling saves companies. The lesson was recognizing when seemingly worthless assets contain hidden value that nobody else sees yet.
Smith didn’t gamble the $5,000 because he was reckless. He bet it because $5,000 worth of short-term survival had zero value if the company died anyway. The marginal utility of extending operations for two days versus seven days was infinite.
That’s exactly where foundry scrap sits today
Most operations view scrap as a cost center: something to minimize, manage, and dispose of efficiently. They’re focused on the $5,000—the immediate material recovery value, the recycling logistics, the quality control challenges.
They’re completely missing the $27,000.
Your scrap metal doesn’t contain one revenue stream. It contains three simultaneously: material cost savings, energy reduction, and carbon credits. Combined, these transform “waste management” into a $1.4M+ annual profit center for mid-sized operations.
But here’s the catch that separates winners from losers: 84% of carbon credits issued under the Kyoto Protocol’s Clean Development Mechanism represented zero real emissions reductions.
The voluntary carbon credit market reached $4.04 billion in 2024 and will hit $23.99 billion by 2030. That’s nearly 6x growth in five years. But most of that value flows to projects with verified, additional, permanent emissions reductions—not greenwashing schemes that claim credit for business-as-usual activities.
Smart foundries are betting on circular metallurgy right now because the odds just shifted dramatically in their favor.
The Three Revenue Streams Most Foundries Never Count
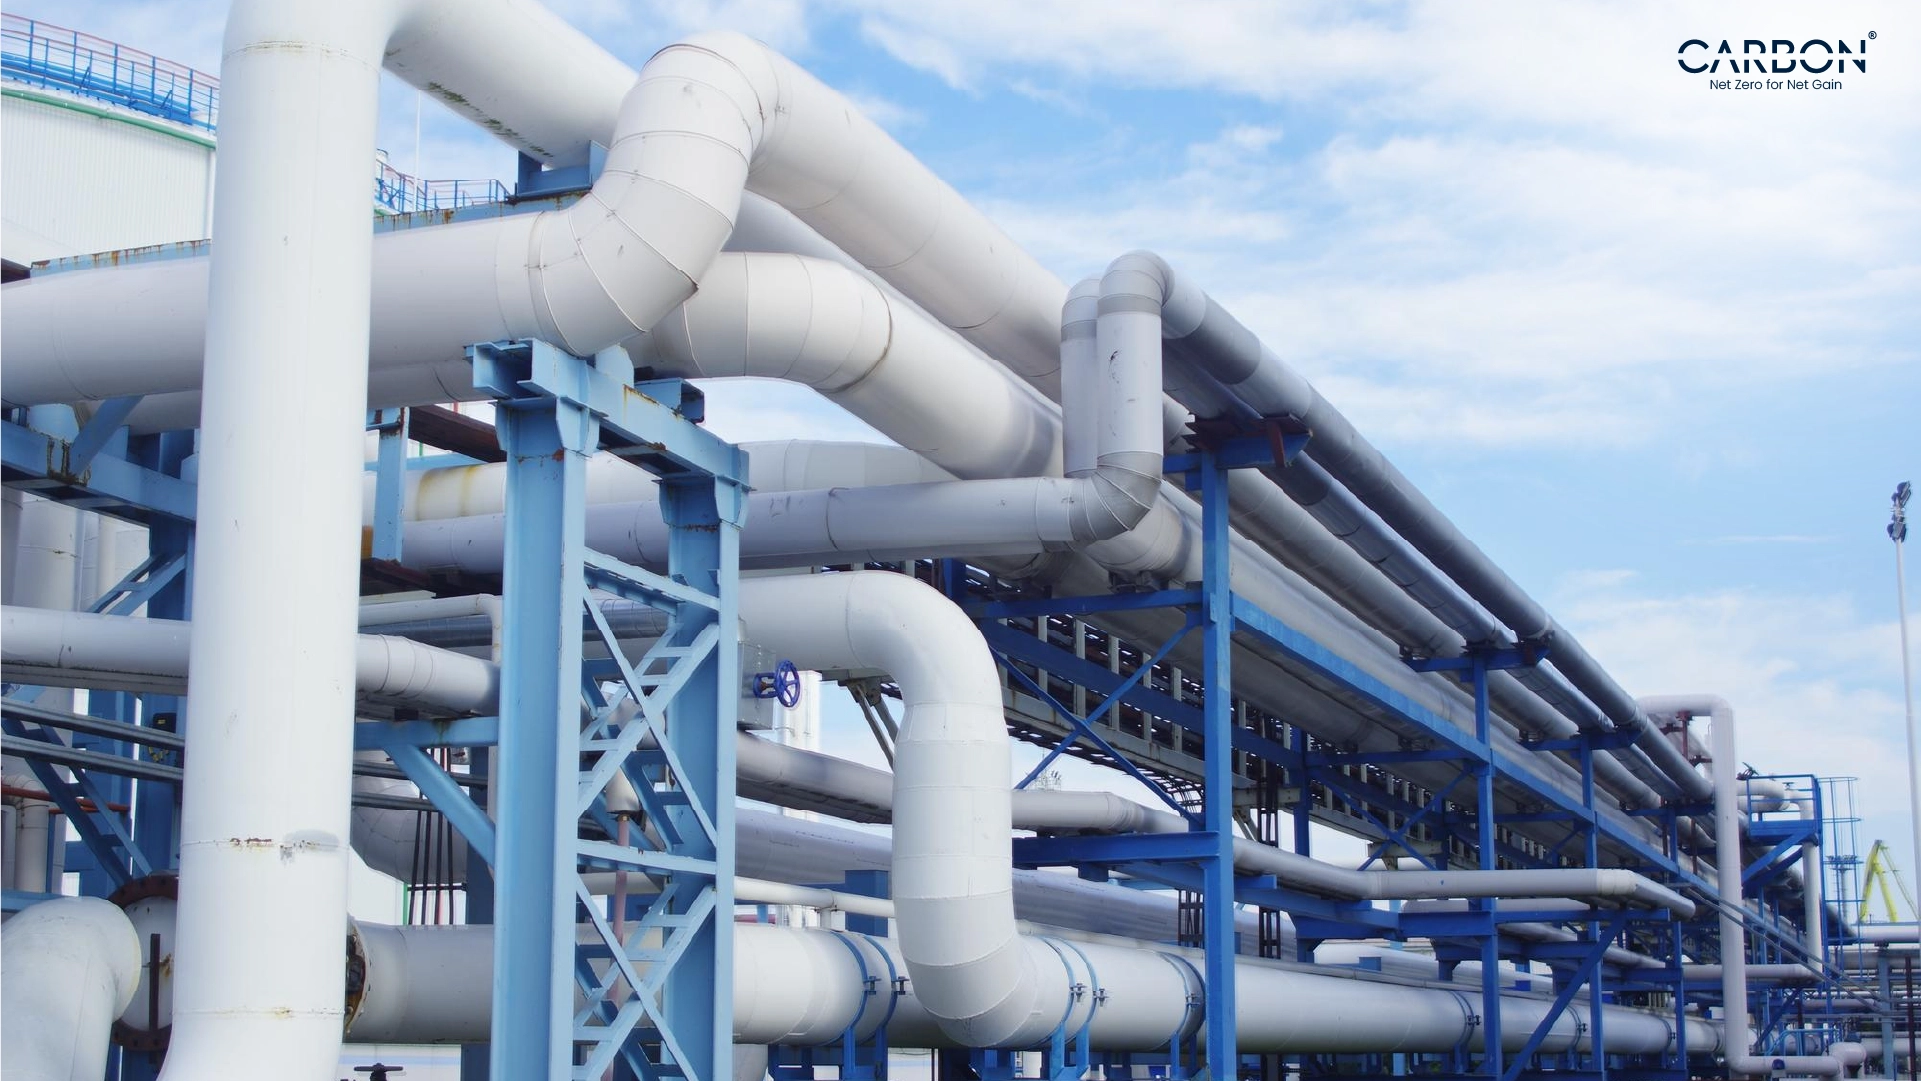
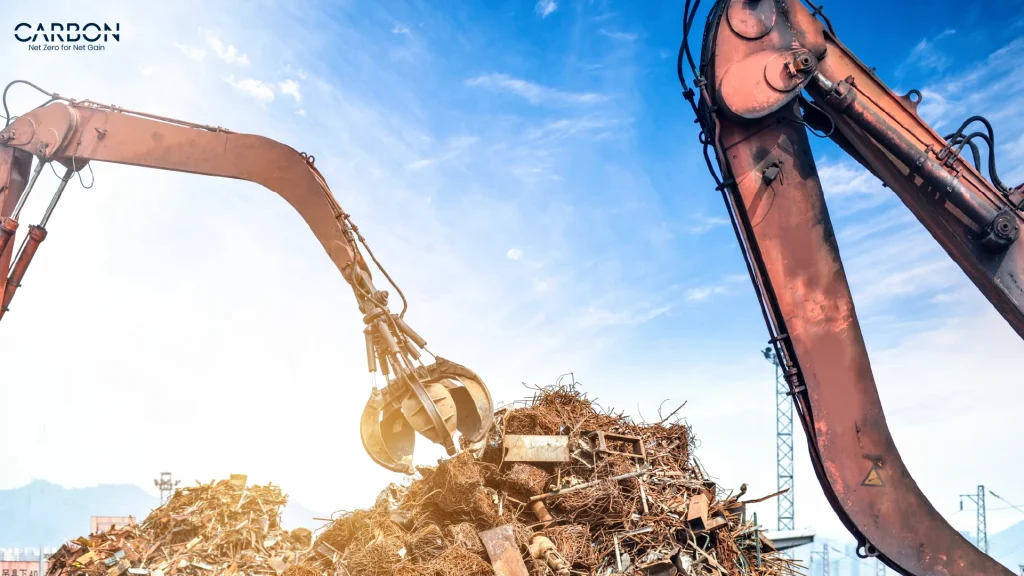
Walk into any foundry, and you’ll see scrap metal everywhere: trimmed gates, rejected castings, machining chips, offcuts from bars and plates. Most operations track this material as inventory loss or recycling revenue.
They’re counting one stream while three flow past them daily.
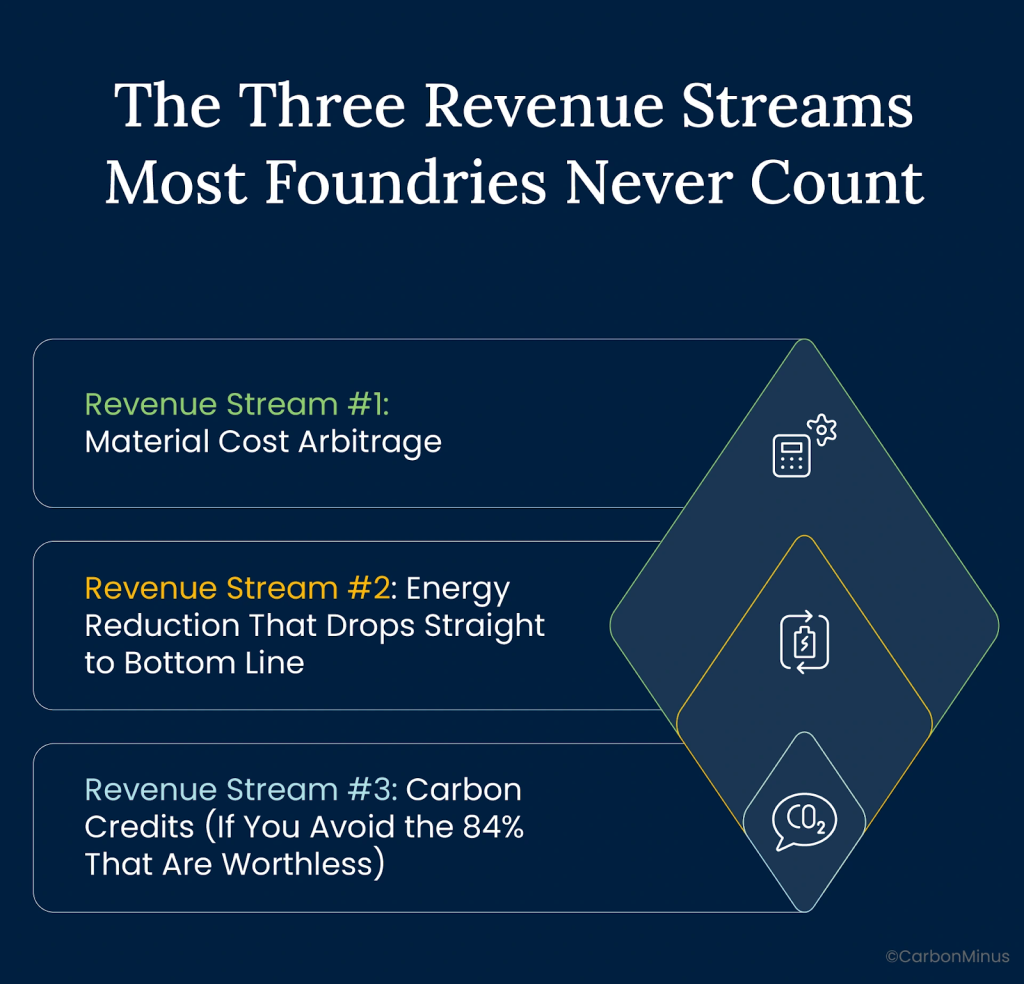
Revenue Stream #1: Material Cost Arbitrage
Virgin steel pricing in the U.S. averages $352-400 per ton as of 2025. Steel scrap trades at $225-276 per ton for HMS 1&2 grade, roughly 40% lower.
In India, the gap is similar: mild steel scrap costs ₹23,000-28,000 per ton ($276-$336 USD) while virgin steel commands significantly higher prices.
Aluminum shows even wider spreads. Recycled aluminum costs 20-40% less than virgin material depending on grade and market conditions.
For a 10,000-ton annual production foundry, this material arbitrage alone delivers –
- Steel operations: $2M-$4M annual savings ($200-400/ton × 10,000 tons)
- Aluminum operations: $5M-$10M annual savings ($500-1,000/ton × 10,000 tons)
But material cost advantage is table stakes. Every foundry knows scrap is cheaper than virgin. That’s revenue stream #1, the $5,000 sitting on the table.
Streams #2 and #3 are the $27,000 hidden underneath.
Revenue Stream #2: Energy Reduction That Drops Straight to Bottom Line
According to Siderweb Research Office and European foundry data, steel production using recycled scrap consumes 74% less energy than virgin blast furnace production.
Aluminum recycling delivers even more dramatic savings: primary energy demand drops from 183 gigajoules per tonne for virgin production to just 8.3 gigajoules per tonne for recycled material: a 95.5% energy reduction confirmed by the International Aluminium Institute.
The Aluminum Association states it plainly: Recycled aluminum saves 95% of the energy needed to make new aluminum from raw materials.
Let’s make this concrete for a 10,000-ton steel foundry
- Virgin production energy: ~20,000 kWh per ton
- Recycled production energy: ~5,200 kWh per ton
- Energy savings: 14,800 kWh per ton
- Annual energy reduction: 148 million kWh
- At $0.07-0.12 per kWh: $1.04M-$1.78M annual savings
For aluminum foundries, the economics are even more compelling
- Virgin production energy: ~51 kWh per kg
- Recycled production energy: ~2.3 kWh per kg
- Energy savings: 48.7 kWh per kg
- 10,000-ton annual operation: $3.4M-$5.8M annual savings at typical industrial rates
Recycling aluminum saves 95% of the energy needed to make new aluminum from raw materials. Aluminum can be recycled directly back to itself forever without any loss in quality.
—The Aluminum Association
This isn’t theoretical efficiency. This is cash flowing directly to your bottom line every month—cash that requires zero additional production capacity or market share gains.
Revenue Stream #3: Carbon Credits (If You Avoid the 84% That Are Worthless)
Here’s where most foundries either get confused or get scammed.
A 2024 study published in Nature by Probst et al. examined projects certified under the Kyoto Protocol’s Clean Development Mechanism (CDM), the framework that issued hundreds of millions of carbon credits.
The findings were devastating: We estimate that less than 16% of the carbon credits issued to the investigated projects constitute real emission reductions.
84% were worthless. They claimed credit for reductions that would have happened anyway, double-counted benefits, or failed basic additionality tests.
So why are smart foundries rushing into carbon credits now instead of avoiding them entirely?
Because the market just got religion about quality.
The voluntary carbon credit market reached $4.04 billion in 2024 and is projected to hit $23.99 billion by 2030, representing 5.9x growth at a 35.1% compound annual growth rate. Alternative projections suggest potential expansion to $100-250 billion depending on corporate net-zero commitments and regulatory developments.
But this growth isn’t uniform. High-quality, verified credits command 10-100x premium pricing over low-quality offsets.
The market has bifurcated into three tiers –
Tier 1 Credits ($2-7 per ton): Questionable additionality, limited verification, high risk of reputational damage
Tier 2 Credits ($10-24 per ton): Verified reductions through Verra (VCS Program), Gold Standard, or other recognized certification bodies with moderate additionality
Tier 3 Credits ($170-500 per ton): Premium offsets with exceptional permanence, co-benefits, and third-party validation
Foundry scrap recycling, when properly certified through Verra’s Verified Carbon Standard or similar rigorous methodologies, sits squarely in Tier 2-3.
Here’s why –
Virgin steel production (blast furnace-basic oxygen furnace): 2.1 tons CO2 per ton steel
Recycled steel production (electric arc furnace): 0.7 tons CO2 per ton steel
Net CO2 avoidance: 1.4 tons CO2 per ton recycled steel
ThyssenKrupp confirms this calculation: About 1 tonne of CO2 per tonne of recycled material can be avoided” through optimized scrap recycling processes.
For a 10,000-ton steel foundry using 100% recycled feedstock:
- Annual CO2 avoidance: 14,000 tons
- Carbon credit revenue (Tier 2, $20/ton average): $280,000 annually
- Carbon credit revenue (Tier 3, $40/ton): $560,000 annually
For aluminum operations, the numbers are even larger due to the massive energy intensity difference (95% reduction).
But, and this is critical, these credits only have value if they meet strict additionality and verification requirements.
You can’t claim carbon credits for
- Recycling you were already doing before establishing the program
- Reductions mandated by regulation (no additionality)
- Activities that would be economically attractive without carbon credit revenue
You can claim credits for
- Expanding scrap recycling capacity beyond business-as-usual
- Implementing advanced sorting/processing that enables higher-quality secondary material
- Displacing virgin material consumption through verified supply chain traceability
That’s why POSCO’s circular economy initiative is the perfect case study: they didn’t just recycle scrap—they fundamentally transformed their production model in ways that weren’t economically obvious before carbon pricing existed.
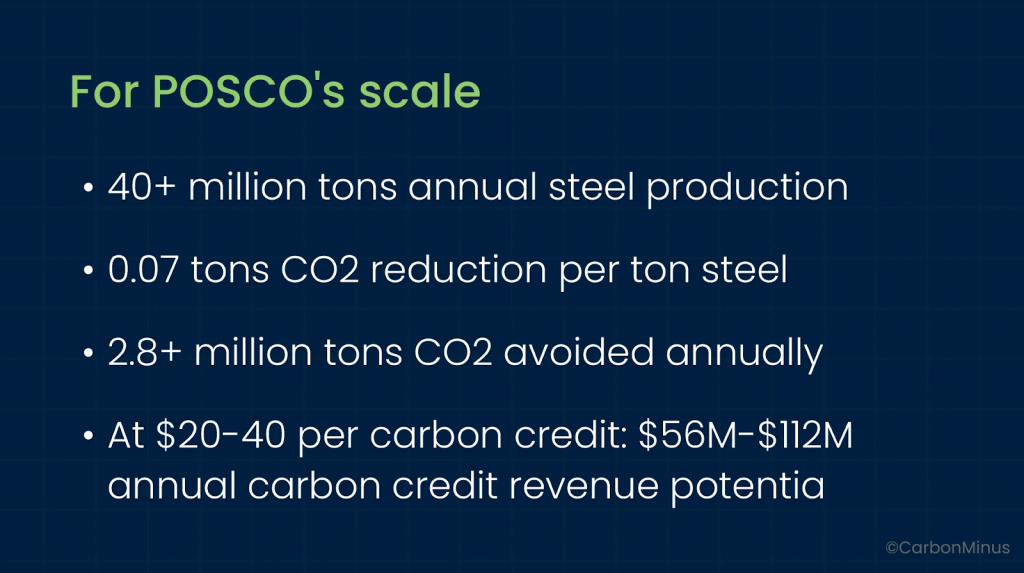
How POSCO Turned Scrap from 15% to 50% (And Cut CO2 by 3%)
POSCO, one of the world’s largest steel producers, faced a problem that every foundry manager will recognize: conventional blast furnaces have strict limits on how much scrap they can process without compromising quality.
Industry standard? Around 15% scrap maximum in typical BF-BOF operations.
This wasn’t a policy choice. It was a metallurgical constraint. Excessive scrap introduces temperature instability, slag chemistry issues, and quality variability that conventional furnaces can’t handle.
So POSCO did something radical: they developed a new type of heat converter specifically designed to increase the scrap usage limit from 15% to 50%.
The results documented by the Economic Research Institute for ASEAN and East Asia (ERIA) are remarkable:
CO2 emissions per tonne of produced steel decreased by more than 3%, from 2.10 tonnes to 2.03 tonnes.
That might not sound dramatic until you run the math on a multi-million-ton annual operation.
But the carbon credits were just stream #3. POSCO simultaneously captured:
Material cost savings from substituting expensive virgin iron with lower-cost scrap
Energy reductions from the inherently lower energy intensity of scrap-based production (74% less energy per ton)
Quality maintenance through the specialized converter design that handled higher scrap ratios without compromising product specifications
POSCO developed a new type of heat converter to increase the limit from 15 percent to 50 percent of conventional scrap usage, reducing CO2 emissions per tonne from 2.10 to 2.03 tonnes, more than 3% reduction.
—ERIA Research Institute
This is the Fred Smith $27,000 moment for circular metallurgy.
POSCO didn’t see their scrap limitation as an immutable constraint. They recognized that the marginal value of increasing scrap usage from 15% to 50% (material savings + energy reduction + carbon credits) was high enough to justify developing entirely new processing technology.
They bet on the hidden value. And they won.
Now that technology and the economic framework exist, mid-sized foundries don’t need to develop new converters from scratch. The pathway from 15-20% scrap usage to 40-60% is already mapped with quantified ROI and verified emissions reductions.
The Quality Problem That Kills 84% of Carbon Credits
Before you start counting carbon credit revenue, understand why 84% of Kyoto Protocol CDM credits were worthless.
The Nature study by Probst et al. identified systematic failures:
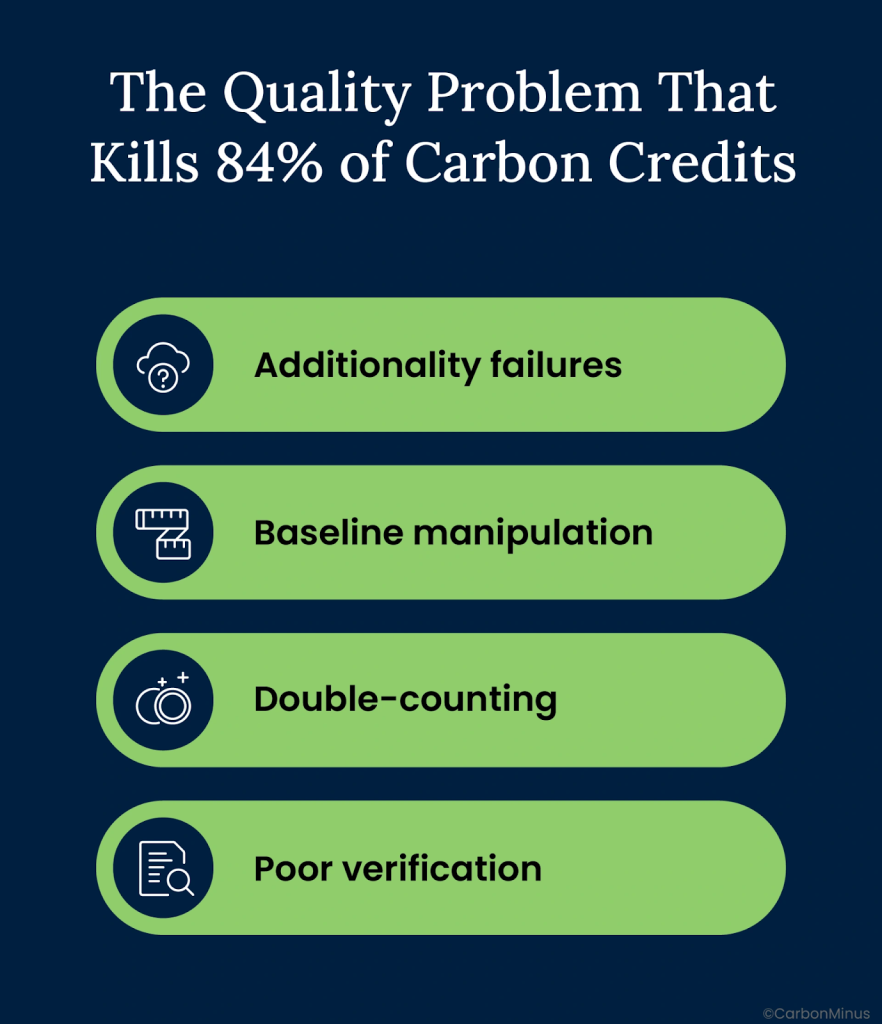
Additionality failures: Projects claimed credits for reductions that would have happened anyway without carbon credit revenue
Baseline manipulation: Projects inflated their “business-as-usual” baselines to claim larger reductions
Double-counting: Multiple parties claimed credit for the same physical emission reduction
Lack of permanence: Reductions weren’t sustained over time or were reversed after credit issuance
Poor verification: Third-party auditors rubber-stamped projects without rigorous validation
The result? Corporate buyers got burned, paying premium prices for credits that delivered zero climate benefit. Reputational damage was severe. Many companies now refuse to purchase any carbon offsets, regardless of quality.
This creates a massive opportunity for foundries with genuinely verified circular metallurgy programs.
The market bifurcation means high-quality credits command 10-100x premiums over low-quality alternatives. Corporate buyers desperate for credible offsets will pay $40-500 per ton for credits that meet strict verification standards—while refusing to pay even $2-7 for questionable projects.
How to ensure your foundry’s carbon credits fall in the high-value 16%, not the worthless 84%.
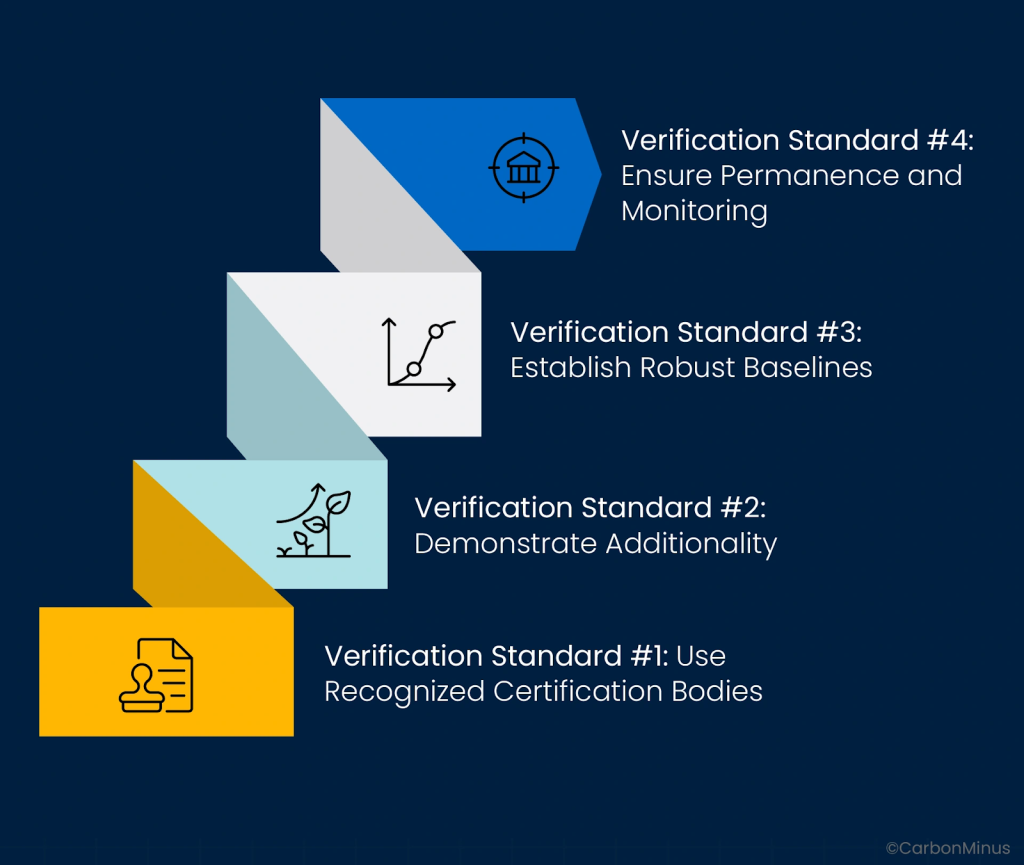
Verification Standard #1: Use Recognized Certification Bodies
Verra’s Verified Carbon Standard (VCS Program) is the most widely used framework for voluntary carbon credits, with detailed methodologies for industrial emissions reductions.
Gold Standard provides even more rigorous certification with strong co-benefits requirements (social and environmental).
Climate Action Reserve and American Carbon Registry are also recognized for specific project types.
Avoid: Self-certification, unrecognized registries, or credits without third-party verification.
Verification Standard #2: Demonstrate Additionality
Your circular metallurgy program must be additional, meaning it wouldn’t have happened without carbon credit revenue.
Passing additionality
- Expanding scrap recycling capacity from 15% to 50% (like POSCO) with documented technology investment
- Implementing advanced sorting/processing systems that weren’t economically viable at previous carbon prices
- Establishing supply chain traceability systems that verify displacement of virgin material
Failing additionality
- Claiming credits for scrap recycling you were already doing
- Projects mandated by local regulation (not additional)
- Activities that would be profitable without carbon credit revenue
Verification Standard #3: Establish Robust Baselines
Your baseline (what would have happened without the project) must be conservative, verifiable, and independently audited.
Strong baseline approaches
- Historical scrap usage data averaged over 3-5 years
- Industry benchmarks for comparable operations
- Conservative assumptions that understate (not overstate) reductions
Weak baselines that won’t pass certification
- Cherry-picked high-emission periods
- Inflated business-as-usual projections
- Baselines that assume no efficiency improvements over time
Verification Standard #4: Ensure Permanence and Monitoring
Carbon credits require ongoing monitoring and verification that reductions persist over time.
Effective monitoring systems
- Real-time energy consumption tracking by production line
- Material traceability systems that document scrap vs. virgin usage
- Quarterly third-party audits with transparent reporting
Inadequate monitoring
- Annual self-reported estimates
- Inconsistent measurement methodologies
- No independent verification of claims
The irony is that foundry scrap recycling is one of the easiest activities to verify rigorously because…
- Material flows are already tracked for production management
- Energy consumption is metered at equipment level
- CO2 avoidance is calculable from established emissions factors (2.1 tons vs. 0.7 tons per ton steel)
- Additionality is demonstrable when expanding beyond historical baselines
The 84% that failed weren’t manufacturing projects. They were forestry offsets with unverifiable permanence, renewable energy projects that would have been built anyway, and carbon capture schemes with inflated baselines.
Foundries have a structural credibility advantage—if they pursue proper certification from the start.
Why 2026 Changes Everything: CBAM Flips the Game
If carbon credits were just voluntary offset markets, foundries could afford to wait and see how pricing evolves.
But January 1, 2026 changes that calculation permanently.
The European Union’s Carbon Border Adjustment Mechanism (CBAM) enters full enforcement on January 1, 2026, applying to imports of steel, aluminum, cement, fertilizers, hydrogen, and electricity into EU markets.
Here’s how it works:
High-carbon imports — such as virgin steel emitting 2.1 tons of CO₂ per ton — now face CBAM certificate purchases based on their embedded emissions. As more regions begin to trade with CBAM, manufacturers will need to account for carbon costs directly in their pricing and sourcing strategies.
Low-carbon imports (recycled steel at 0.7 tons CO2 per ton) face proportionally lower CBAM costs.
The differential creates immediate competitive advantage for circular metallurgy operations exporting to EU markets.
At current EU ETS carbon prices (~€75-90 per ton CO2), the CBAM advantage for recycled vs. virgin steel is approximately:
- (2.1 – 0.7) tons CO2 × €80 = €112 per ton steel
- For 10,000-ton exports: €1.12M annual advantage
If EU carbon prices rise to €100-120 per ton (projected by 2030), the advantage grows to €140-168 per ton steel.
“The Carbon Border Adjustment Mechanism will apply in its definitive regime from 2026, creating immediate competitive advantage for low-carbon steel and aluminum producers serving EU markets.” —European Commission
For Indian and U.S. foundries exporting to Europe, this isn’t a future concern—it’s a 2026 competitive reality.
Foundries that establish verified circular metallurgy programs now (2025) will have:
- Documented baselines proving additionality
- Multi-year emissions data for carbon credit certification
- Supply chain traceability systems for CBAM compliance
- Cost structures optimized for low-carbon production
Foundries that wait until 2026 will face:
- CBAM costs eating into margins immediately
- No historical baseline for carbon credit claims (additionality failures)
- 12-18 month delays establishing verification systems
- Competitive disadvantage vs. peers who moved earlier
The EU just made Fred Smith’s bet mandatory for anyone serving European markets. The $5,000 (business-as-usual operations) has zero value if you can’t access $27,000 (EU market access) next year.
The Real Economics: What 1,000 Tons vs. 10,000 Tons Actually Generates
Let’s cut through the theory and run the numbers for three representative foundries.
Small Steel Foundry (1,000 Tons Annual Production)
Investment Required:
- Advanced scrap sorting/processing: $200K-$400K
- Energy monitoring systems: $80K-$150K
- Carbon credit certification: $60K-$120K
- Total investment: $340K-$670K
Annual Revenue Streams:
Material cost savings:
- 1,000 tons × $200-400/ton virgin vs. scrap differential
- Annual value: $200K-$400K
Energy cost reduction:
- 1,000 tons × 14,800 kWh/ton × $0.07-0.12/kWh
- Annual value: $104K-$178K
Carbon credit revenue:
- 1,000 tons × 1.4 tons CO2 avoided × $20-40/ton
- Annual value: $28K-$56K
Total Annual Value: $332K-$634K
Simple Payback: 6-24 months
IRR: 50-95% (5-year project horizon)
Medium Aluminum Foundry (5,000 Tons Annual Production)
Investment Required:
- Advanced scrap processing with grade separation: $800K-$1.5M
- Energy monitoring and optimization: $250K-$400K
- Carbon credit certification (Verra VCS): $150K-$250K
- Total investment: $1.2M-$2.15M
Annual Revenue Streams:
Material cost savings:
- 5,000 tons × $500-1,000/ton virgin vs. scrap differential
- Annual value: $2.5M-$5M
Energy cost reduction:
- 5,000 tons × 48.7 kWh/kg × 1,000 kg/ton × $0.07-0.12/kWh
- Annual value: $1.7M-$2.9M
Carbon credit revenue:
- 5,000 tons aluminum × 9 tons CO2 avoided/ton × $20-40/ton
- Annual value: $900K-$1.8M
Total Annual Value: $5.1M-$9.7M
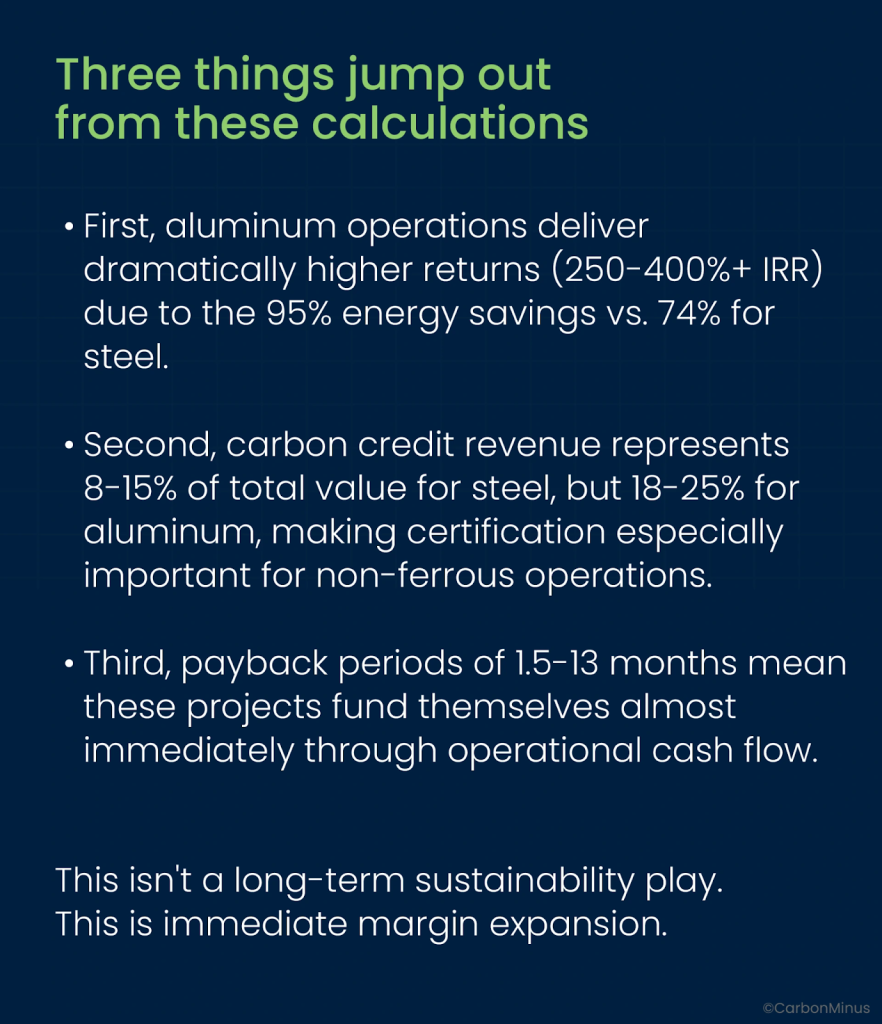
Simple Payback: 1.5-5 months
IRR: 250-400%+ (5-year project horizon)
Large Steel Foundry (10,000 Tons Annual Production)
Investment Required:
- Comprehensive scrap processing facility: $1.5M-$2.5M
- Real-time energy management systems: $400K-$650K
- Carbon credit certification and monitoring: $200K-$350K
- Total investment: $2.1M-$3.5M
Annual Revenue Streams:
Material cost savings:
- 10,000 tons × $200-400/ton virgin vs. scrap differential
- Annual value: $2M-$4M
Energy cost reduction:
- 10,000 tons × 14,800 kWh/ton × $0.07-0.12/kWh
- Annual value: $1.04M-$1.78M
Carbon credit revenue:
- 10,000 tons × 1.4 tons CO2 avoided × $20-40/ton
- Annual value: $280K-$560K
Total Annual Value: $3.32M-$6.34M
Simple Payback: 4-13 months
IRR: 95-150% (5-year project horizon)
The Three Mistakes That Kill Circular Metallurgy ROI
Most foundries that attempt circular metallurgy programs fail to capture the full $27,000. They get the $5,000 (basic material savings) but miss streams #2 and #3 because they make one of three fatal errors:
Mistake #1: Claiming Carbon Credits for Business-as-Usual
You cannot claim carbon credits for scrap recycling you were already doing before establishing a certified program.
Failing additionality
- “We’ve always used 20% scrap, so we deserve 20% of the credits”
- NO. Your baseline is 20%. You can only claim credits for increases above that.
Passing additionality
- “We increased scrap usage from 20% to 45%, and here’s the documented investment that made it possible”
- YES. The 25% increase is additional and can be certified.
This is why establishing baselines now (2025) is critical. Every month you wait, your “business-as-usual” baseline creeps higher, eating into the additionality you can claim later.
Mistake #2: Choosing Low-Quality Certification to Save Money
Some foundries see the $60K-$350K certification cost and try to cut corners with unrecognized registries or self-certification.
This is catastrophic economic logic.
High-quality Verra or Gold Standard certification costs $60K-$350K but delivers carbon credits worth $20-500 per ton.
Low-quality certification costs $10K-$40K but delivers credits worth $2-7 per ton (if buyers accept them at all).
For a 10,000-ton foundry generating 14,000 carbon credits annually.
- Verra-certified credits: 14,000 × $20-40 = $280K-$560K annual revenue
- Low-quality credits: 14,000 × $2-7 = $28K-$98K annual revenue
- Certification cost differential: ~$200K upfront
The high-quality certification pays for itself in 4-9 months through higher credit prices and protects your reputation from the 84% of worthless credits that buyers now avoid.
Mistake #3: Optimizing for One Stream Instead of Three
Some foundries focus exclusively on material cost savings (stream #1) while ignoring energy reduction (stream #2) and carbon credits (stream #3).
This leaves 40-60% of total value uncaptured.
Integrated optimization means –
- Scrap sourcing contracts that prioritize both cost and verified supply chain traceability (enabling carbon credits)
- Processing investments that deliver both material quality and energy efficiency (capturing streams #1 and #2)
- Real-time monitoring systems that track production metrics and emissions data (enabling carbon credit certification)
POSCO didn’t just increase scrap usage from 15% to 50%. They simultaneously…
- Reduced energy consumption per ton (stream #2)
- Documented CO2 reductions for carbon credit programs (stream #3)
- Maintained product quality to preserve market pricing (protecting stream #1)
That integration is why their ROI was compelling enough to justify developing entirely new converter technology.
Your 90-Day Roadmap: From Scrap Yard to Triple-Stream Revenue
Based on POSCO’s documented approach and verified circular metallurgy best practices, here’s your implementation framework.
Days 1-30: Establish Baseline and Certification Pathway
Conduct comprehensive scrap usage audit covering previous 36 months
- Current scrap percentage by material type
- Virgin vs. scrap cost differential by grade
- Energy consumption per ton by production method
- Quality control data comparing virgin vs. scrap-based production
Select certification body (Verra VCS strongly recommended for industrial projects):
- Submit preliminary project documentation
- Confirm methodology applicability
- Establish baseline and additionality framework
Calculate three-stream revenue projections
- Material savings (stream #1)
- Energy reduction (stream #2)
- Carbon credit revenue (stream #3)
Deliverable: Board-ready business case with verified baseline, certification pathway, and 5-year financial projections.
Days 31-60: Implement Monitoring and Establish Traceability
Install real-time energy monitoring systems at equipment level
- Melting furnaces (primary energy consumer)
- Material handling systems
- Air compressors and auxiliary systems
Establish scrap supply chain traceability
- Document sourcing for every scrap batch
- Implement material grade verification protocols
- Create digital records for carbon credit auditing
Deploy production tracking systems
- Batch-level scrap vs. virgin usage
- Energy consumption per ton by material source
- Quality metrics comparing production methods
Deliverable: Real-time dashboard showing three-stream value generation with audit-ready documentation.
Days 61-90: Scale Operations and Submit Certification
Increase scrap usage systematically
- Start with high-certainty grades (proven quality)
- Expand to more challenging materials as processes stabilize
- Document investment in processing equipment/technology that enables increases
Conduct third-party verification audit
- Baseline validation
- Additionality demonstration
- Monitoring system verification
- Emissions quantification methodology review
Submit carbon credit certification application
- Verra VCS Project Description
- Supporting documentation (baselines, monitoring plans, additionality proof)
- Third-party verification report
Deliverable: Certified carbon credit program generating revenue within 90-120 days of project start.
Ongoing: Maintain Certification and Optimize Returns
Quarterly verification audits to maintain certification
Continuous optimization of scrap processing to maximize all three revenue streams simultaneously
Market monitoring to optimize carbon credit sales timing (prices vary seasonally)
Baseline updates as regulations and market conditions evolve (especially post-2026 CBAM implementation)
The $4 Billion Market That Becomes $24 Billion by 2030
The voluntary carbon credit market reached $4.04 billion in 2024 and will hit $23.99 billion by 2030, representing 5.9x growth at a 35.1% compound annual growth rate.
But that headline number obscures the real story: market bifurcation between high-quality and low-quality credits.
Low-quality credits (the 84% that don’t represent real reductions) are seeing price collapse and demand destruction as corporate buyers refuse to risk reputational damage.
High-quality credits (properly certified, additional, permanent reductions) are seeing explosive demand growth as companies with genuine net-zero commitments scramble for credible offsets.
Some market segments project growth to $100-250 billion by 2030 depending on regulatory developments and corporate commitment trajectories.
Foundry circular metallurgy programs, when properly certified, sit at the premium end of this market.
- Verifiable additionality through documented increases in scrap usage above historical baselines
- Permanent reductions that persist as long as production continues
- Robust quantification using established emissions factors (2.1 tons vs. 0.7 tons CO2 per ton steel)
- Third-party validation through Verra, Gold Standard, or equivalent certification bodies
- Co-benefits including energy security, resource efficiency, and reduced mining impacts
This is why early movers capture disproportionate value. Foundries that establish certified programs in 2025 will.
- Lock in favorable baselines before rising industry averages make additionality harder to prove
- Build multi-year emissions data that strengthens certification and enables premium pricing
- Establish buyer relationships with corporate purchasers seeking reliable long-term offset suppliers
- Capture first-mover advantage in markets (like India) where circular metallurgy carbon credits are still undervalued
Foundries that wait until 2027-2028 will face.
- Higher certification costs as demand overwhelms verification capacity
- Lower credit prices as supply increases faster than demand in some segments
- Regulatory uncertainty around additionality standards and baseline methodologies
CBAM compliance costs eating margins while competitors already optimized for low-carbon production
The voluntary carbon credit market reached $4.04 billion in 2024 and will grow to $23.99 billion by 2030 at 35.1% CAGR. High-quality, verified credits command 10-100x premiums over low-quality offsets.
—Grand View Research, 2024
Fred Smith’s bet wasn’t reckless, it was perfectly timed. He recognized that the option value of extending operations for one more week was infinite if it created the window for permanent financing.
Circular metallurgy in 2025 is that same moment.
The certification infrastructure exists (Verra, Gold Standard). The market pricing is established ($20-500 per ton for quality credits). The regulatory drivers are locked in (CBAM 2026). The corporate demand is exploding (5.9x growth to 2030).
The only question is whether you establish your baseline now or explain to your board in 2027 why competitors captured the value first.
When Scrap Becomes Your Most Valuable Asset
Most foundries still view scrap metal as a cost center: something to minimize, manage, and dispose of efficiently.
That’s like FedEx in 1973 viewing their last $5,000 as “barely enough for two days of fuel”, technically accurate but strategically blind to the option value contained within.
Your scrap yard contains three simultaneous revenue streams worth $1.4M+ annually for mid-sized operations:
Material cost arbitrage ($200-1,000 per ton depending on metal)
Energy reduction (74-95% savings vs. virgin production)
Carbon credits (1.4 tons CO2 avoided per ton steel recycled)
Combined through integrated circular metallurgy programs, these streams deliver.
- 1,000-ton steel foundry: $332K-$634K annually, 6-24 month payback
- 5,000-ton aluminum foundry: $5.1M-$9.7M annually, 1.5-5 month payback
- 10,000-ton steel foundry: $3.32M-$6.34M annually, 4-13 month payback
But only 16% of carbon credit projects deliver real value. The other 84% failed basic additionality and verification tests.
Smart foundries bet on quality certification through Verra or Gold Standard now (2025), establishing baselines before CBAM enforcement makes low-carbon production mandatory for EU market access in 2026.
POSCO proved the model works at scale: 15% to 50% scrap usage, 3% CO2 reduction, millions in annual value across all three streams.
The voluntary carbon credit market is growing from $4.04 billion in 2024 to $23.99 billion by 2030 but the growth is concentrated in high-quality, verified credits that foundries are uniquely positioned to generate.
Fred Smith walked into those Las Vegas casinos because $5,000 of short-term survival had zero marginal value if the company died anyway. He bet everything on one more week because one more week created the option to solve the problem permanently.
Your scrap metal is that same bet.
It’s worth $5,000 as a cost center. It’s worth $27,000 as three integrated revenue streams.
The only question is whether you’re counting one number or three.
How CarbonMinus Helps Foundries Monetize All Three Revenue Streams
CarbonMinus provides real-time energy monitoring and carbon accounting platforms specifically designed for heavy industries like foundries. Our system makes all three revenue streams visible, quantifiable, and certifiable, creating the data foundation required for premium carbon credit certification.
Real-time tracking of material flows, energy consumption, and emissions by production batch
Automated baseline establishment and additionality documentation for carbon credit programs
Certification-ready reporting that meets Verra VCS and Gold Standard requirements
ROI tracking across all three revenue streams with audit-ready documentation
To learn more about capturing triple-stream value from circular metallurgy, visit
carbonminus.com or calculate your foundry’s potential revenue at roi.carbonminus.com.
FAQs
How much are carbon credits actually worth for foundry scrap recycling?
Carbon credit prices vary dramatically based on quality and certification. Low-quality credits trade at $2-7 per ton CO2, but these often fail buyer acceptance due to additionality concerns. High-quality credits certified through Verra’s Verified Carbon Standard or Gold Standard command $20-40 per ton for industrial emissions reductions, with premium offsets reaching $170-500 per ton. For a 10,000-ton steel foundry avoiding 1.4 tons CO2 per ton recycled (14,000 credits annually), this translates to $280,000-$560,000 in annual carbon credit revenue with proper certification.
Why did 84% of Kyoto Protocol carbon credits fail?
A 2024 study published in Nature found that only 16% of carbon credits issued under the Kyoto Protocol’s Clean Development Mechanism represented real emission reductions. The remaining 84% failed due to: additionality failures (claiming credits for reductions that would have happened anyway), inflated baselines, double-counting, lack of permanence, and inadequate verification. This catastrophic failure rate has made corporate buyers extremely cautious, creating premium pricing for foundries that pursue rigorous certification through Verra or Gold Standard from the start.
How did POSCO increase scrap usage from 15% to 50% without compromising quality?
POSCO developed a new type of heat converter specifically designed to handle higher scrap ratios in blast furnace operations. Conventional BF-BOF processes are limited to approximately 15% scrap due to temperature instability and slag chemistry issues. POSCO’s specialized converter technology increased this limit to 50%, resulting in CO2 emissions per tonne dropping from 2.10 to 2.03 tonnes—a 3% reduction. This breakthrough, documented by the Economic Research Institute for ASEAN and East Asia, maintained product quality while unlocking material savings, energy reduction, and carbon credit revenue.
What’s the real CO2 avoidance from steel recycling?
Virgin steel production via blast furnace-basic oxygen furnace (BF-BOF) generates 2.1 tons CO2 per ton of steel. Recycled steel production via electric arc furnace (EAF) generates 0.7 tons CO2 per ton. The net CO2 avoidance is therefore 1.4 tons per ton of recycled steel (2.1 – 0.7 = 1.4). ThyssenKrupp confirms this calculation, stating “about 1 tonne of CO2 per tonne of recycled material can be avoided” through optimized scrap recycling processes. For aluminum, the avoidance is even larger due to the 95% energy savings compared to virgin production.
How does EU’s Carbon Border Adjustment Mechanism (CBAM) affect foundries?
CBAM enters full enforcement on January 1, 2026, applying to steel and aluminum imports into EU markets. Importers must purchase CBAM certificates based on embedded CO2 emissions in their products. Virgin steel (2.1 tons CO2/ton) faces higher CBAM costs than recycled steel (0.7 tons CO2/ton), creating an approximately €112-168 per ton competitive advantage for circular metallurgy operations at current EU carbon prices (€80-120/ton). For foundries exporting 10,000 tons annually to Europe, this represents €1.12M-€1.68M in avoided CBAM costs compared to virgin steel competitors.
What’s the payback period for circular metallurgy investments?
Payback periods vary by foundry size and material type but range from 1.5 to 24 months depending on scale and configuration. A 1,000-ton steel foundry typically sees 6-24 month payback on $340K-$670K investment, capturing $332K-$634K in annual value across material savings, energy reduction, and carbon credits. A 5,000-ton aluminum foundry achieves 1.5-5 month payback on $1.2M-$2.15M investment, generating $5.1M-$9.7M annually due to aluminum’s 95% energy savings advantage. Large steel foundries (10,000 tons) see 4-13 month payback on $2.1M-$3.5M investment with $3.32M-$6.34M annual returns.
Why is aluminum recycling more profitable than steel recycling?
Aluminum recycling saves 95.5% of energy compared to virgin production—from 183 gigajoules per tonne for primary aluminum to just 8.3 gigajoules per tonne for recycled material. Steel recycling saves approximately 74% of energy. This dramatic energy advantage means aluminum operations capture 3-5x larger energy reduction revenue (stream #2) compared to steel foundries of equivalent tonnage. The Aluminum Association confirms: “Recycled aluminum saves 95% of the energy needed to make new aluminum from raw materials… and this process can happen virtually infinitely”.
How do I ensure my carbon credits fall in the valuable 16%, not the worthless 84%?
Focus on rigorous certification through recognized bodies like Verra’s Verified Carbon Standard or Gold Standard. Demonstrate clear additionality by documenting increases in scrap usage above historical baselines (not claiming credits for existing practices). Establish conservative, verifiable baselines using 3-5 years of historical data. Implement robust monitoring systems with real-time energy and material tracking. Conduct regular third-party verification audits to maintain certification. Foundries have structural advantages because material flows and energy consumption are already measured for production management, making verification straightforward compared to forestry or renewable energy offsets that failed under Kyoto Protocol.