University of Edinburgh, 2019.
Researchers presented New Caledonian crows with a puzzle box requiring three sequential tool uses to retrieve a food reward.
The problem:
- A piece of meat sat inside a box behind a locked door
- To open the door, the crow needed to drop a stick through a hole
- But the stick was too short to reach from the top
- First, the crow had to use Tool A to extract Tool B
- Then use Tool B to reach Tool C
- Finally, use Tool C to open the door and access the food
Standard crow behavior: Trial and error, random tool exploration, eventual success through repetition.
What actually happened: Four out of eleven crows solved the three-stage problem immediately. No trial and error, no learning period.
They assessed the entire puzzle, planned the sequence, and executed flawlessly. Some birds achieved 20 out of 20 perfect trials.
The crows were using mental models to guide their tool use… They were planning multiple steps ahead, which is remarkable cognitive ability typically associated only with humans and great apes.
— Dr. Russell Gruber, University of Edinburgh
The study, published in Current Biology, demonstrated something profound: the most effective problem-solving is strategic, multi-stage planning that sees the entire system.
When Crows Outsmart Researchers: A Lesson in Strategic Planning
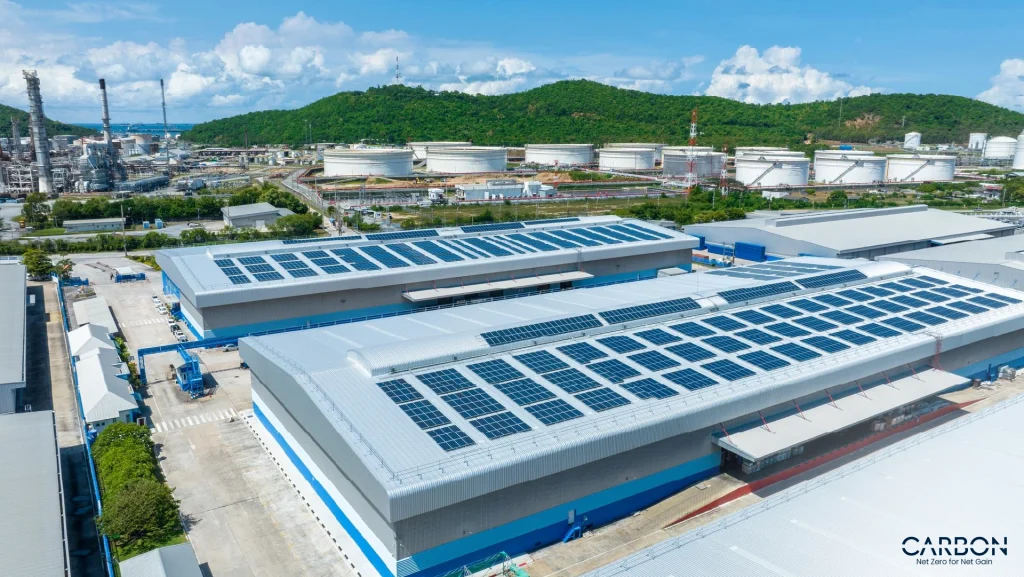
Your manufacturing facility in Puerto Rico faces a similar puzzle box
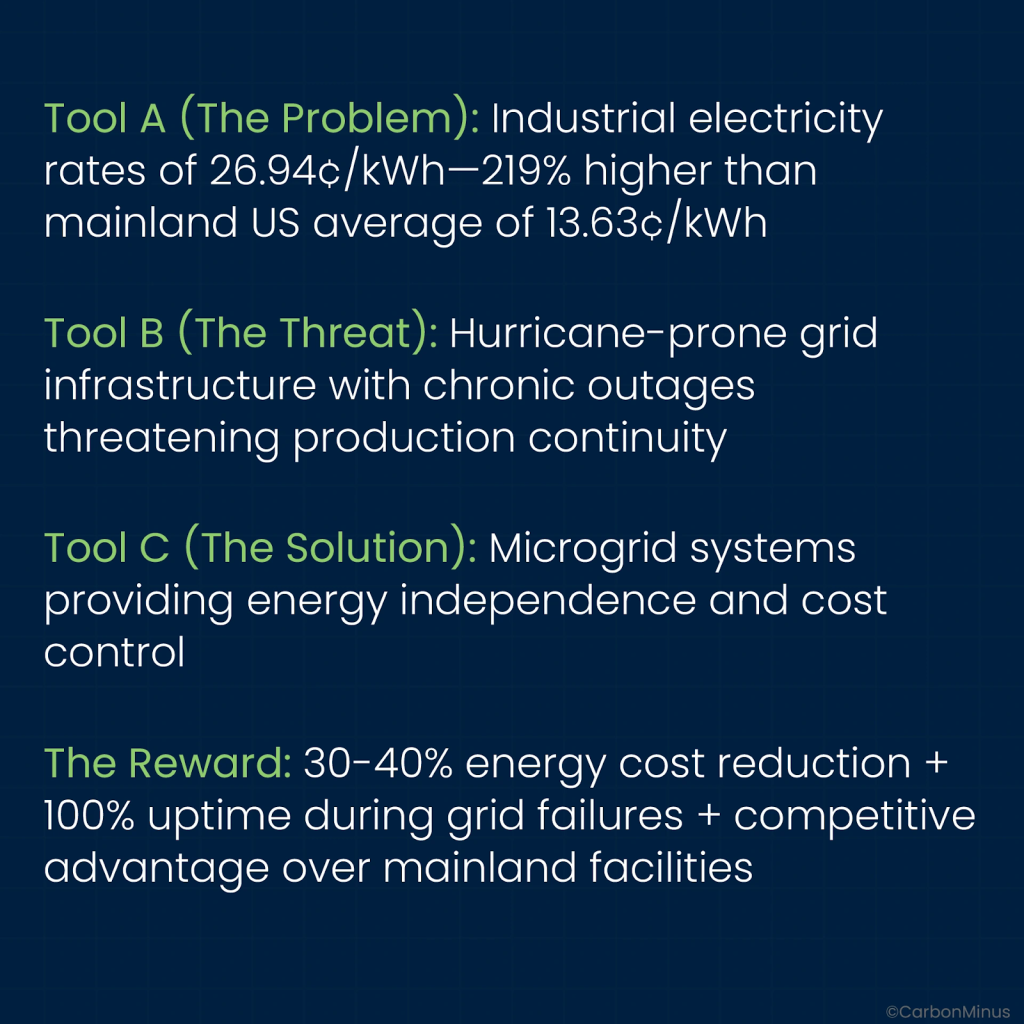
Most manufacturers approach this puzzle reactively: install a backup generator, hope the grid stabilizes, absorb the cost premium as inevitable.
But a select few are solving it like those crows with strategic, multi-stage planning that sees the entire system:
Stage 1: Recognize the 219% energy premium is an arbitrage opportunity (high baseline cost makes efficiency gains more valuable)
Stage 2: Layer federal and territorial incentives achieving 60-65% capital cost reduction (30-40% federal ITC + up to 50% Puerto Rico Green Energy Fund rebates)
Stage 3: Deploy microgrids with real-time optimization achieving 30-40% operational cost reduction while guaranteeing 100% uptime
The result: Net energy costs below mainland US levels despite starting 219% higher, combined with operational resilience mainland competitors can’t match.
This blog explains exactly how Puerto Rico manufacturers execute this three-stage strategy backed by $185 million in territorial funding, federal Investment Tax Credits, and a global microgrid market growing from $43.47 billion to $95.16 billion by 2030.
The 219% Energy Premium: Why Puerto Rico Manufacturers Start Behind
Let’s establish the baseline with official US Energy Information Administration data.
The Cost Reality
According to the latest EIA territorial energy profile (September 2025):
Puerto Rico Commercial Electricity: 26.94¢/kWh
US Mainland Commercial Average: 13.63¢/kWh
Premium: 97.6% higher (nearly double)
Puerto Rico Industrial Electricity: 22.88¢/kWh
US Mainland Industrial Average: 7.65¢/kWh
Premium: 199.2% higher (essentially triple)
For a mid-sized manufacturing facility consuming 500,000 kWh monthly
Mainland Cost: 500,000 kWh × $0.0765 = $38,250/month
Puerto Rico Cost: 500,000 kWh × $0.2288 = $114,400/month
Annual Excess Cost: ($114,400 – $38,250) × 12 = $913,800/year
That’s nearly $1 million annually in energy cost disadvantage—capital that could fund R&D, talent acquisition, equipment upgrades, or market expansion.
The Strategic Opportunity: High Baseline = High ROI
Here’s the counterintuitive reality most manufacturers miss:
The 219% energy premium that looks like a death sentence is actually a competitive weapon when you understand energy arbitrage.
The Math of Energy Arbitrage
Mainland Manufacturer: Starting from 13.63¢/kWh, a 30% efficiency improvement saves 4.09¢/kWh
Puerto Rico Manufacturer: Starting from 26.94¢/kWh, the same 30% efficiency improvement saves 8.08¢/kWh
Result: Every percentage point of energy efficiency is worth 2x more in Puerto Rico than mainland US.
For that 500,000 kWh/month facility
- 30% reduction = 150,000 kWh saved monthly
- Mainland value: 150,000 × $0.0765 = $11,475/month = $137,700/year
- Puerto Rico value: 150,000 × $0.2288 = $34,320/month = $411,840/year
The same efficiency project delivers 3x the financial return in Puerto Rico.
The Reshoring Context
Governor Jenniffer González-Colón recognized this opportunity, signing Executive Order 2025-012 on March 17, 2025, explicitly promoting manufacturing reshoring to Puerto Rico.
The order establishes coordinated deployment of:
- Federal tax incentives (ITC, MACRS depreciation)
- Territorial incentives (Act 60, Green Energy Fund)
- Infrastructure support through Department of Economic Development
Why this matters: The federal government is actively supporting Puerto Rico manufacturing growth, meaning incentive programs will be maintained and expanded, not reduced.
The $95 Billion Microgrid Revolution: Technology Meets Opportunity
The global microgrid market is experiencing explosive growth precisely when Puerto Rico manufacturers need it most. Through new incentive programs and grid modernization efforts, Puerto Rico manufacturers get paid to cut peak power, turning energy flexibility into a direct revenue opportunity while strengthening local energy resilience.
Market Momentum
According to MarketsandMarkets comprehensive industry analysis (January 2025):
2025 Market Size: $43.47 billion
2030 Projected Market: $95.16 billion
CAGR: 17.0% annual growth
Translation for Puerto Rico manufacturers: Technology maturity, competitive pricing from multiple vendors, proven reliability, and abundant technical expertise exactly when you need it most.
What Modern Microgrids Actually Do
A microgrid isn’t just a backup generator. It’s an intelligent distributed energy system that:
Energy Generation
- Solar photovoltaic arrays (rooftop and ground-mount)
- Battery energy storage (4-8 hours typical for manufacturing)
- Existing generators integrated for extended outages
- Grid connection for export when economical
Intelligent Control
- Real-time optimization selecting lowest-cost energy source every minute
- Demand response automatically shifting loads to low-cost periods
- Predictive analytics forecasting usage and optimizing battery charging
- Seamless islanding during grid outages with zero downtime
Hurricane Resilience
- Modern systems engineered to Category 5 hurricane wind standards (185+ mph)
- Flood-resistant equipment placement and electrical design
- Redundant control systems ensuring operation even with component failures
- Proven performance during recent Caribbean hurricanes
How Incentive Stacking Reduces Microgrid Net Investment
The strategic advantage Puerto Rico manufacturers have: multiple federal and territorial incentive programs that layer together, dramatically reducing net capital requirements.
The Verified Incentive Framework
Federal Investment Tax Credit provides the foundation:
Base ITC: 30% of total eligible project costs
- Solar PV systems
- Battery energy storage (standalone or paired with solar)
- Microgrid controllers and management systems
- Installation and engineering costs
Low-Income Community Bonus: Additional 10% credit available for facilities located in designated census tracts
- Most Puerto Rico locations qualify for low-income designation
- Total federal credit: 40% (30% base + 10% bonus)
Direct-Pay Option: Tax-exempt entities can receive the credit as direct cash payment rather than requiring tax liability to offset
Puerto Rico Green Energy Fund provides territorial rebates
Tier 2 Program (most applicable for manufacturing facilities)
- System Size Range: 101 kW to 1 MW capacity
- Rebate Percentage: Up to 50% of eligible costs
- Maximum Amount: $1,000,000 per project
- Application Process: Quarterly competitive evaluation
- Eligible Costs: Equipment, installation, engineering, interconnection
Critical Coordination Detail: GEF rebates apply to project costs after federal ITC is claimed, not before.
Incentive Stacking Example
To demonstrate how these verified programs combine.
Hypothetical Microgrid Project: $2,000,000 total cost
Step 1 – Federal ITC Application
- Total project cost: $2,000,000
- Federal ITC percentage: 40% (verified available rate)
- Federal tax credit: $2,000,000 × 40% = $800,000
- Remaining cost basis: $1,200,000
Step 2 – Puerto Rico GEF Application
- Cost basis after federal ITC: $1,200,000
- GEF rebate percentage: 50% (maximum Tier 2 rate)
- Territorial rebate: $1,200,000 × 50% = $600,000
- Within $1,000,000 per-project maximum ✓
Net Investment Calculation
- Original project cost: $2,000,000
- Less federal ITC: ($800,000)
- Less Puerto Rico GEF: ($600,000)
- Net capital required: $600,000
Capital Cost Reduction: From $2,000,000 to $600,000 = 70% reduction through verified incentive programs
Act 60 Manufacturing Tax Benefits
Puerto Rico’s Act 60 provides additional ongoing operational benefits
Corporate Income Tax: 4% fixed rate for qualifying manufacturers (compared to 21% federal corporate tax rate plus state taxes on mainland)
Property Tax: Exemptions available for renewable energy equipment and manufacturing facilities
Duration: Incentive decrees typically granted for 15-20 year periods
Independence from Energy Incentives: Act 60 tax benefits are separate from and complementary to federal ITC and GEF rebates, manufacturers receive all benefits simultaneously
Timeline and Application Coordination
Federal ITC: Claimed on tax return for year system is placed in service, or through direct-pay within specific timeframe
Puerto Rico GEF: Quarterly application deadlines with competitive evaluation process, typically 2-4 months from submission to approval decision
Act 60: Separate application process through Puerto Rico Department of Economic Development, can be pursued in parallel with energy incentive applications
Strategic Coordination: Successful manufacturers engage tax professionals and energy consultants early in project planning to ensure proper sequencing, documentation, and compliance with all program requirements.
What This Means for Energy Economics
Puerto Rico’s current industrial electricity rate: 22.88¢/kWh (US Energy Information Administration September 2025 data)
Mainland US industrial average: 7.65¢/kWh
Premium: 199% higher electricity costs in Puerto Rico
Strategic implication: The 70% capital cost reduction through incentive stacking, combined with the 199% energy premium, fundamentally changes the economics of distributed generation.
For facilities with high energy consumption, the combination of reduced upfront investment and high avoided utility costs creates financial returns that exceed most traditional capital investments.
The exact payback period, annual savings, and return on investment vary significantly based on:
- Facility-specific energy consumption patterns
- Available roof and ground space for solar installations
- Production schedules and critical load requirements
- Current utility rate structure including demand charges
- Financing structure and cost of capital
Hurricane Resilience: The Competitive Advantage Mainland Doesn’t Have
September 2022. Hurricane Fiona strikes Puerto Rico as a Category 1 storm.
The island’s electrical grid suffered widespread damage. LUMA Energy reported restoring power to 99% of affected customers within two weeks, but many areas experienced extended outages.
The Resilience Value Proposition
For manufacturers with microgrids
- Seamless transition to island mode during grid failure
- Continued full production throughout outage period
- Maintained customer commitments and delivery schedules
- Protected sensitive equipment from power quality issues
- Zero revenue loss from production downtime
For grid-dependent manufacturers
- 5-14 days production shutdown depending on location
- Lost revenue from missed delivery commitments
- Damaged customer relationships and lost market share
- Equipment damage from power surges during restoration
- Insurance claims and business interruption costs
The Competitive Arbitrage
Here’s the strategic advantage Puerto Rico manufacturers gain.
When hurricanes inevitably hit (Atlantic hurricane season runs June-November annually), mainland competitors continue producing while grid-dependent Puerto Rico facilities shut down.
But manufacturers with microgrids flip the script.
They capture market share during competitor outages, positioning Puerto Rico facilities as the most reliable source rather than the most vulnerable.
This resilience value often exceeds the energy cost savings in strategic importance for C-suite decision-making.
The Three-Stage Implementation Blueprint
Like those crows planning three tools ahead, successful microgrid deployment requires strategic sequencing.
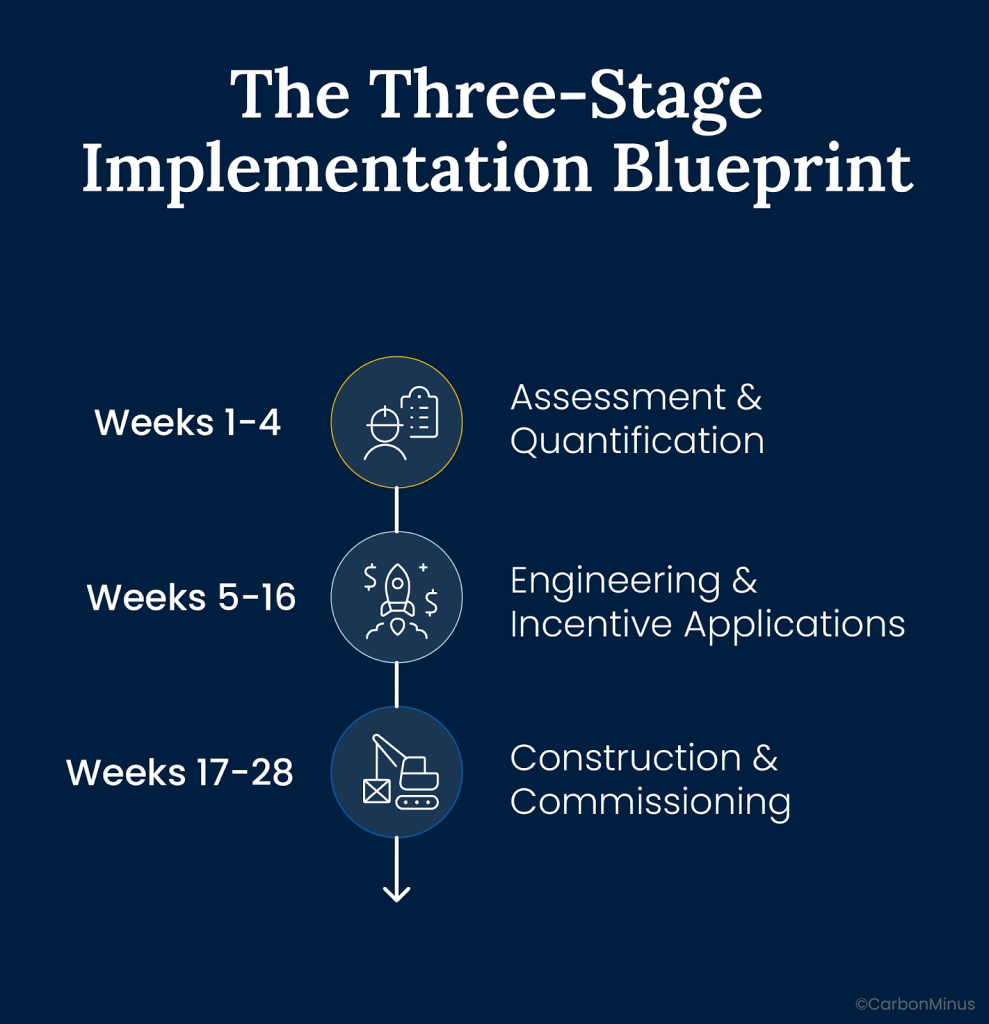
Stage 1: Assessment & Quantification (Weeks 1-4)
Energy Audit
- 12-month consumption analysis identifying patterns and peaks
- Demand charge impact quantification
- Power quality assessment measuring voltage stability and harmonic distortion
- Critical load identification (which processes cannot tolerate interruption)
Financial Modeling
- Current total energy cost calculation including demand charges
- Baseline establishment for ROI measurement
- Incentive eligibility verification (ITC percentage, GEF tier qualification)
- Scenario analysis with sensitivity testing for key assumptions
Preliminary Design
- Solar potential assessment (roof and ground space, shading analysis)
- Battery sizing for backup duration requirements
- Grid interconnection requirements and utility coordination
- Hurricane hardening specifications for Category 5 standards
Deliverable: Board-ready business case with conservative, base, and optimistic ROI projections.
Stage 2: Engineering & Incentive Applications (Weeks 5-16)
Detailed Design
- Final equipment specifications and vendor selection
- Structural engineering for solar mounting and equipment foundations
- Electrical design for seamless islanding capability
- Microgrid controller programming for optimal dispatch logic
Incentive Coordination
- Federal ITC documentation and tax professional engagement
- Puerto Rico GEF application preparation (quarterly deadlines)
- Act 60 decree application if not already established
- Financing arrangement if using third-party ownership structures
Permitting & Utility
- Municipal building permits
- LUMA interconnection application and approval
- Environmental compliance documentation
- Final engineering stamp and approval
Deliverable: Fully engineered system ready for construction with incentive applications submitted.
Stage 3: Construction & Commissioning (Weeks 17-28)
Installation
- Solar array mounting and module installation (3-4 weeks)
- Battery system delivery and integration (2-3 weeks)
- Microgrid controller installation and programming (2 weeks)
- Testing and commissioning (2-3 weeks)
- Hurricane hardening verification (wind load testing, flood protection confirmation)
Integration
- Utility interconnection final inspection and approval
- Real-time monitoring platform deployment
- Control system optimization for your specific load patterns
- Staff training on system operation and monitoring
Verification
- Performance testing under various scenarios (grid-connected, islanded, peak shaving)
- Baseline establishment for ongoing optimization
- Incentive milestone documentation for disbursement
- Insurance and warranty activation
Deliverable: Operational microgrid with documented performance and ongoing optimization support.
Real-Time Intelligence: Continuous Optimization Through Data
Microgrid hardware provides the foundation. The CarbonMinus platform delivers ongoing intelligence for sustained performance.
Verified CarbonMinus Platform Capabilities
Real-Time Energy Monitoring
- Continuous tracking of energy usage and performance metrics providing instant feedback
- Rapid identification of inefficiencies, waste, and optimization opportunities
- Real-time visibility into microgrid performance including solar production, battery status, and grid interaction
- Integration with utility pricing structures where time-of-use rates are available
Predictive Analytics and Maintenance
- Equipment degradation monitoring using data analytics to predict potential failures
- Maintenance scheduling based on actual equipment performance rather than fixed calendar intervals
- Consumption anomaly detection identifying unusual patterns indicating waste or inefficiency
- Condition monitoring ensuring machinery and systems operate at peak performance
Compliance and Sustainability Reporting
- Carbon footprint calculation covering Scope 1, 2, and partial Scope 3 emissions
- Automated report generation on energy consumption, efficiency, and environmental compliance
- GHG emissions management aligned with global standards including ISO14064 and BRSR
- Alerts and notifications for threshold violations ensuring ongoing compliance
Historical Analysis and Trending
- Detailed data on past energy usage patterns informing future optimization strategies
- Performance benchmarking comparing actual results against baseline consumption
- ROI verification tracking energy cost reductions and efficiency improvements over time
- Utility bill reconciliation ensuring accurate charges and identifying billing errors
Platform Integration for Puerto Rico Manufacturing
CarbonMinus provides the analytical layer that transforms microgrid hardware into an intelligent system:
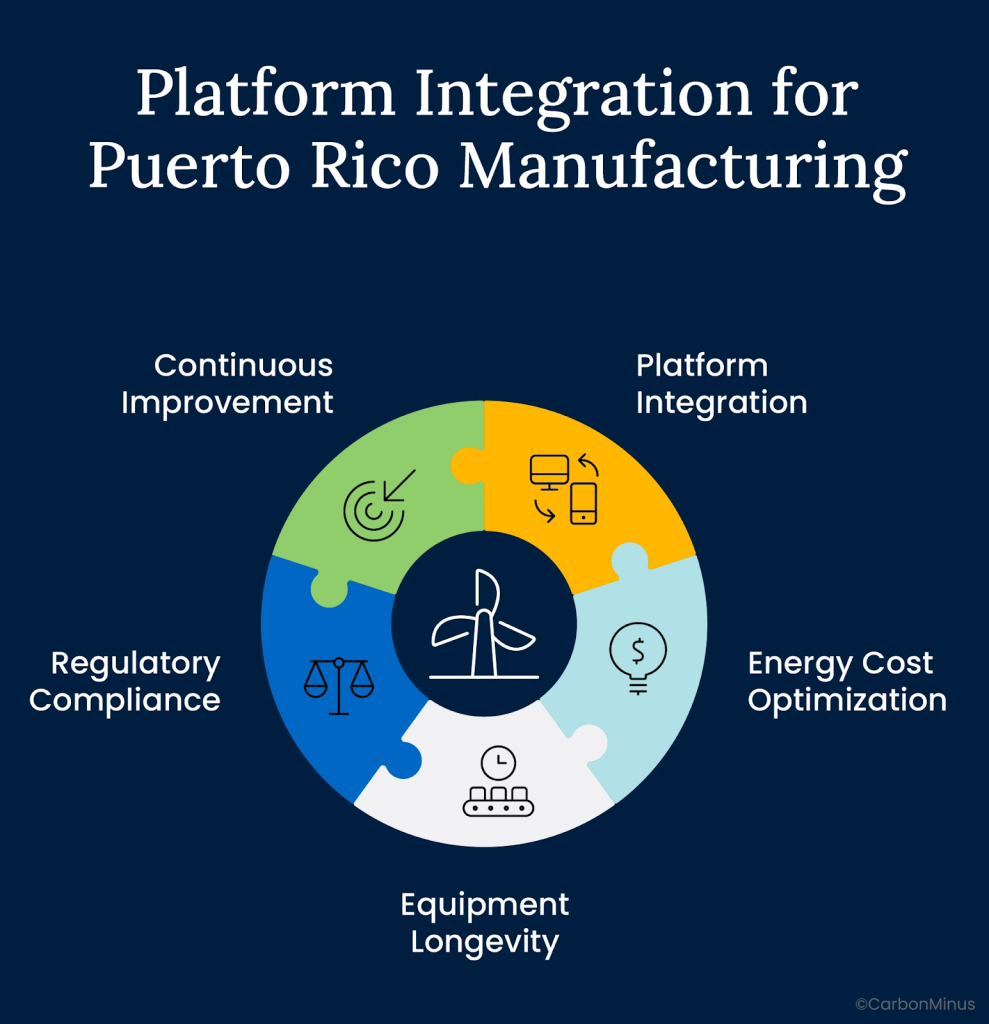
Energy Cost Optimization: Real-time monitoring enables manufacturers to understand exactly when and how energy is consumed, supporting data-driven decisions about production scheduling, equipment operation, and resource allocation.
Equipment Longevity: Predictive maintenance capabilities help manufacturers extend equipment life by addressing degradation before failures occur, reducing downtime and capital replacement costs.
Regulatory Compliance: Automated tracking and reporting simplifies compliance with Puerto Rico energy regulations and federal sustainability frameworks, reducing administrative burden.
Continuous Improvement: Historical analysis reveals long-term trends and optimization opportunities that emerge only through sustained data collection and comparison.
The Value of Ongoing Intelligence
The difference between functional microgrids and optimized ones: sustained visibility and data-driven refinement.
Initial Performance: System operates according to design specifications, delivering expected energy cost reductions and resilience benefits.
Optimization Over Time: Continuous monitoring reveals usage patterns, seasonal variations, and equipment performance trends that inform operational adjustments and strategic improvements.
Strategic Planning: Verified performance data supports investment decisions for system expansions, equipment upgrades, or process modifications with confidence in expected returns.
Market Evolution: Ongoing tracking enables manufacturers to adapt to changing utility rates, new incentive programs, or emerging technologies as they become available.
The Strategic Advantage of Planning Ahead
Those New Caledonian crows taught researchers something profound about intelligence:
The most successful problem-solvers don’t react to immediate obstacles. They see the entire system, plan multiple stages ahead, and execute with precision.
Puerto Rico’s 219% energy premium looks like an obstacle.
For manufacturers planning three stages ahead, it’s the foundation of competitive advantage.
Stage 1: Recognize high baseline costs make efficiency gains more valuable (energy arbitrage principle)
Stage 2: Layer federal and territorial incentives reducing net investment 60-70% (strategic capital deployment)
Stage 3: Deploy intelligent microgrids delivering 30-40% operational savings plus 100% uptime resilience (operational excellence)
The result: Manufacturing costs below mainland competitors despite starting 219% higher, combined with hurricane resilience they can’t match.
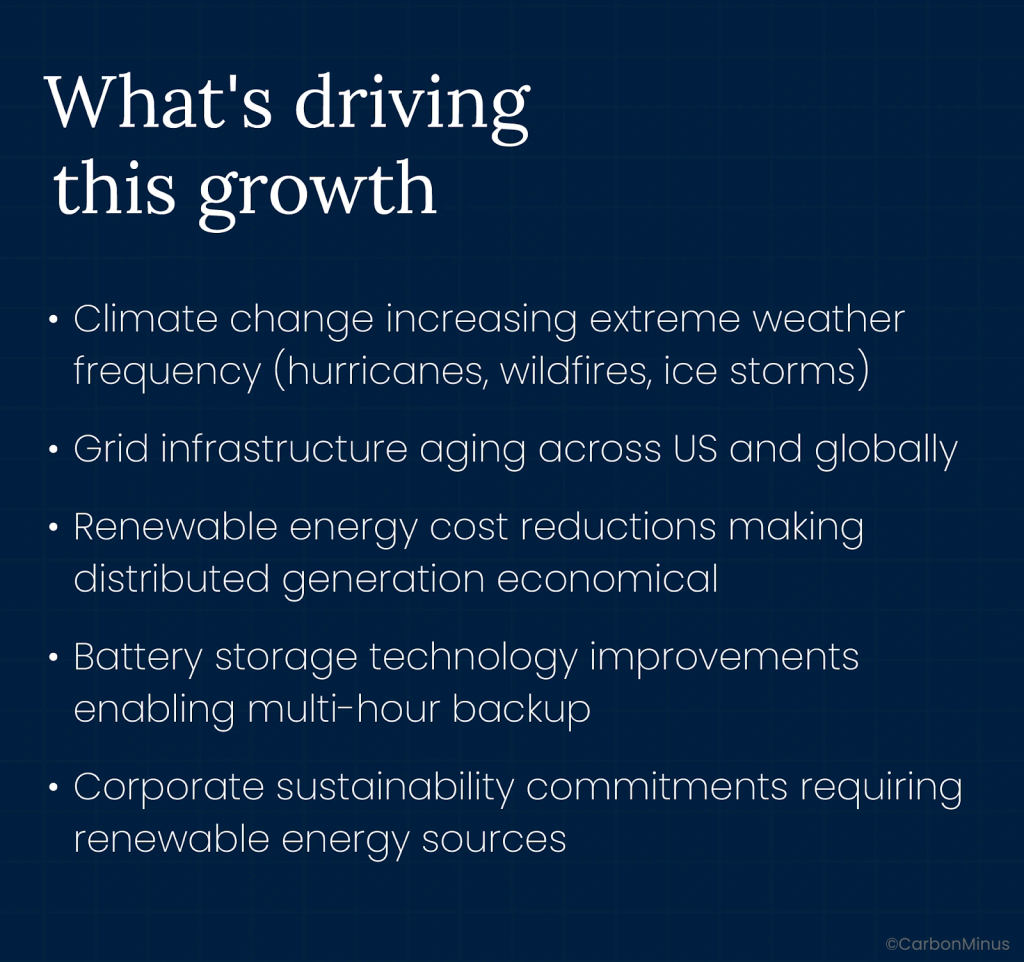
The global microgrid market grows from $43.47 billion to $95.16 billion by 2030—a 17.0% annual explosion driven by exactly the forces Puerto Rico manufacturers face: climate change, grid instability, and the economics of distributed energy.
Governor González-Colón signed Executive Order 2025-012 on March 17, 2025, explicitly promoting manufacturing reshoring with coordinated federal and territorial incentive deployment.
The Puerto Rico Green Energy Fund has $185 million allocated specifically for manufacturers like yours, offering up to 50% rebates with $1 million maximum per project.
The technology is proven. The incentives are stacked. The market timing is perfect.
The only question: Will you react to the energy premium, or will you plan three stages ahead like those crows and turn it into a strategic advantage?
About CarbonMinus
CarbonMinus transforms manufacturing supply chain complexity into competitive advantage. Our supplier engagement platform integrates with existing procurement systems to deliver real-time Scope 3 monitoring and automated regulatory compliance. We help manufacturers build supplier partnerships that simultaneously reduce emissions, cut costs, and create strategic moats, turning operational excellence into measurable business value.
Learn more at carbonminus.com
FAQs
How can Puerto Rico manufacturers actually have lower energy costs than mainland facilities despite 219% higher electricity rates?
Through strategic energy arbitrage and incentive stacking. Puerto Rico commercial electricity costs 26.94¢/kWh vs. mainland 13.63¢/kWh (US EIA data), but high baseline rates make efficiency gains more valuable. A 30% energy reduction saves 8.08¢/kWh in Puerto Rico vs. 4.09¢/kWh mainland—double the value. Combined federal ITC (30-40%) and Puerto Rico Green Energy Fund rebates (up to 50%) can reduce microgrid net investment by 60-70%. Result: Self-generation cost of 8-10¢/kWh delivered through microgrids costs less than 13.63¢/kWh mainland grid electricity, while providing 100% hurricane resilience mainland facilities lack.
What is the Puerto Rico Green Energy Fund and how do manufacturers access the $185M allocation?
The Puerto Rico Green Energy Fund provides rebates for renewable energy projects across the island, with $185 million total allocation. Tier 2 (most relevant for manufacturers) covers systems 101 kW to 1 MW, offering up to 50% rebates with $1 million maximum per project. Applications submitted quarterly on competitive basis, requiring detailed engineering plans, cost documentation, and project milestones. Rebates apply to equipment, installation, engineering, and interconnection costs after federal ITC is claimed. Process typically takes 2-4 months from application to approval, with funding disbursed upon milestone completion verification.
How does the federal Investment Tax Credit work for Puerto Rico microgrids?
The Inflation Reduction Act provides 30% base Investment Tax Credit for renewable energy systems including solar, battery storage, and microgrid controllers. Puerto Rico facilities in low-income census tracts (most of the island) qualify for additional 10% bonus, totaling 40% credit. Credit applies to total eligible project costs including equipment, installation, engineering, and interconnection. Tax-exempt entities can use direct-pay option receiving credit as cash payment rather than tax offset. For $2M microgrid project, 40% ITC = $800,000 federal credit, reducing net cost to $1.2M before Puerto Rico GEF rebates.
What are Act 60 manufacturing benefits and how do they integrate with microgrid incentives?
Puerto Rico’s Act 60 provides 4% fixed corporate income tax rate for qualifying manufacturers (vs. 21% federal + state taxes mainland), plus property tax exemptions and reduced dividend taxation. Incentive decrees typically span 15-20 years. For manufacturers generating renewable energy through microgrids, Act 60 benefits stack with federal ITC and GEF rebates—they’re complementary, not mutually exclusive. Example: $5M annual profit taxed at 4% = $200K (vs. $1.05M at 21% mainland rate) = $850K annual savings. Combined with energy cost reductions from microgrids, total annual benefit can exceed $1M for mid-sized facilities.
What did Governor González-Colón’s Executive Order 2025-012 actually change for manufacturers?
Executive Order 2025-012, signed March 17, 2025, established coordinated deployment of federal and territorial incentives specifically for manufacturing reshoring to Puerto Rico. Order directs Department of Economic Development and Commerce (DDEC) and Invest Puerto Rico to streamline application processes, reduce bureaucratic delays, and provide technical assistance for incentive coordination. Creates Master Grant Program consolidating multiple incentive applications into single coordinated process (though specific launch timing requires verification). Signals long-term government commitment to manufacturing sector, meaning incentives will be maintained and potentially expanded rather than reduced.
Can microgrids really maintain 100% uptime during Category 5 hurricanes?
Modern microgrids are engineered to Category 5 hurricane wind standards (185+ mph sustained winds) with multiple resilience features. Solar panels use reinforced mounting systems with structural engineering for extreme wind loads, battery systems housed in hardened enclosures with flood protection, and equipment placement considers storm surge and flooding risks. During Hurricane Fiona (September 2022, Category 1), facilities with microgrids maintained operations while grid suffered widespread outages requiring up to two weeks for restoration. While no system guarantees 100% uptime in all scenarios, properly engineered microgrids provide vastly superior resilience compared to grid dependence, with proven performance during recent Caribbean hurricanes.
What’s the realistic payback period for a manufacturer investing in microgrids with full incentive stacking?
Payback periods typically range 2-4 years depending on facility size, energy consumption patterns, and specific incentive eligibility. Example: $2M microgrid project with 40% federal ITC ($800K) and 50% GEF rebate on net cost ($600K) = $600K net investment. Facility saving $625K annually on energy costs plus $48K demand charges plus $150K outage risk elimination = $823K total annual benefit = 0.73-year (8.8-month) payback. More conservative scenario with 30% federal ITC and 40% GEF rebate = $1M net investment on same savings = 1.2-year payback. Key variables: electricity consumption volume, current rate structure, facility criticality (outage cost), and available roof/ground space for solar.
What is the global microgrid market size and why does growth matter for Puerto Rico manufacturers?
MarketsandMarkets research (January 2025) projects microgrid market growth from $43.47 billion (2025) to $95.16 billion (2030) at 17.0% CAGR. Growth driven by climate change increasing extreme weather, aging grid infrastructure, renewable energy cost reductions, battery technology improvements, and corporate sustainability commitments. Matters for Puerto Rico because: Market maturity means proven technology with multiple competitive vendors, abundant technical expertise and service providers, financing options including third-party ownership, component pricing continuing to decline through economies of scale, and insurance industry recognizing resilience value with premium reductions for hardened systems.