Key Takeaways
- Most plants miss early warning signs because energy, safety, and ops data live in silos.
- Real-time monitoring of load, pressure, and flow reveals anomalies before they become incidents.
- Cross-signal correlation helps filter noise and focus on true risks.
- Energy systems should trigger safety actions—not just energy alerts.
- Treating energy as a live risk signal shifts safety from reactive to predictive.
A steam line bursts. A fan stalls in a confined space. A compressor overheats—and no one sees it coming. Why?
Because in most plants, energy, maintenance, and safety still operate in silos. The systems don’t talk. The signals don’t align. And when things go wrong, they go wrong fast.
Every year, industrial facilities face shutdowns, safety violations, and preventable injuries—not because the equipment fails without warning, but because early warnings go unheard. One system sees the symptom. Another holds the cause. But no one connects the dots in time.
The problem isn’t technical complexity. It’s operational blindness.
When energy data stays on one dashboard, maintenance logs on another, and safety thresholds buried in procedure binders—hazards get missed. Patterns slip past. And the overlap between rising load, lagging response, and risk gets more dangerous by the day.
You can’t mitigate what you can’t see. And in most plants, no one’s watching the overlap.
We Track Kilowatts, Not Consequences
In most plants, energy gets managed like a utility bill. The focus is narrow: reduce consumption, shift loads, dodge peak demand charges. Efficiency is measured in kilowatt-hours—not in safety margins.
This mindset works, until it doesn’t.
Because the systems that use the most energy—steam lines, compressed air networks, chillers, and ventilation—also carry the highest risk. They generate heat, pressure, force, and flow. When something slips, those physical forces don’t just waste power. They trigger hazards.
Take compressed air. A regulator starts to drift. Pressure creeps from 100 to 120 PSI. The system draws more load to compensate. Energy data notices—but no one’s looking at that load spike as a risk. Safety systems stay silent. Until a pipe gives way.
That’s the real gap. We optimize for cost. We ignore the consequences.
And when we treat energy as just a number on a bill. Not as a dynamic, physical force because we miss the early signs that could prevent the next incident.
The Overlap That Fails First
Before something breaks, it behaves differently.
A ventilation fan slows just enough to reduce airflow in a confined space. Heat and fumes start to rise.
A cooling loop underdelivers flow. Temperature climbs. The motor draws harder. The risk of arc flash ticks up.
A boiler with internal scale loses balance. Pressure builds unevenly. A relief valve meant to protect, can’t keep up.
These aren’t isolated failures. They’re system-level breakdowns with early warning signs. But those signs get buried — one in a SCADA screen, one in a maintenance ticket, one in a post-incident report.
The thread connecting them is energy. Energy behaves abnormally before systems do.
But unless you’ve integrated your thermal, electrical, and mechanical data across teams, not just tools, you’re blind to that behavioral drift.
Silos Don’t See Risk. They Just Record It
Every plant has data. What’s missing is connection.
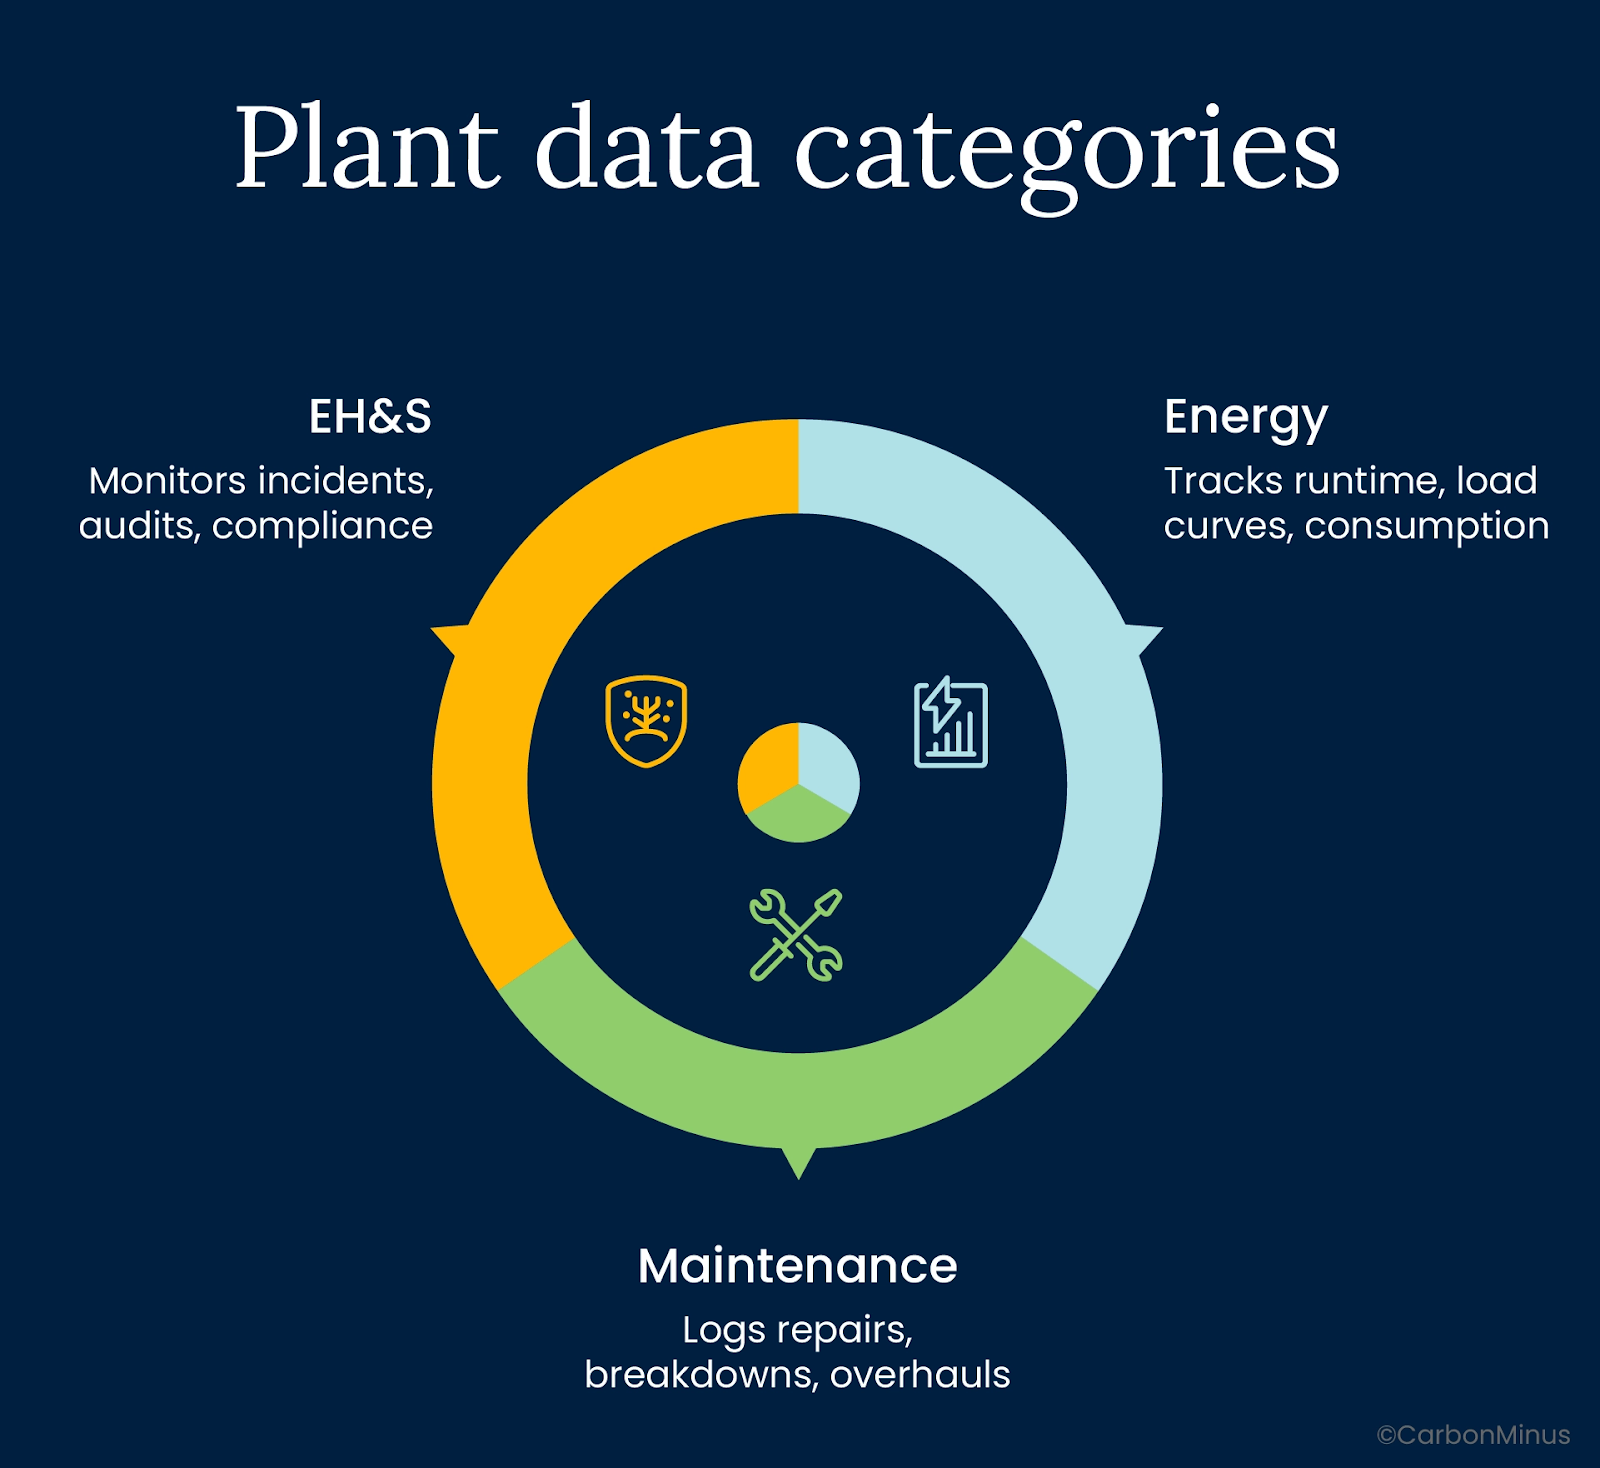
- Energy teams track runtime, load curves, and consumption peaks.
- Maintenance logs repairs, breakdowns, and scheduled overhauls.
- EH&S monitors incidents, audits, and compliance thresholds.
Each group sees a sliver of the system. But no one sees how a rising load on a chiller aligns with a rising temperature in a process zone. Or how a vibration anomaly in a pump maps to a safety deviation logged two shifts later.
The root cause isn’t failure. It’s fragmentation.
Without a shared layer of insight, teams react late or not at all. And when warning signs span systems, they don’t trip alarms. They fall between them.
What’s missing isn’t more data. It’s a unified view—a system-level awareness that flags operational drift before it becomes a hazard.
Until that’s built, plants will keep logging what happened, while missing what’s about to.
The New Mandate: Monitoring for Risk, Not Just Cost
Energy data isn’t just a cost metric anymore. It’s a frontline safety signal.
High-performing plants now treat load curves, flow rates, and thermal anomalies as early warnings—not afterthoughts.
What does that look like in practice?
From Cost Signals to Risk Signals
The shift is clear: leading plants no longer use energy data just to chase efficiency. They use it to prevent hazards.
Here’s how:
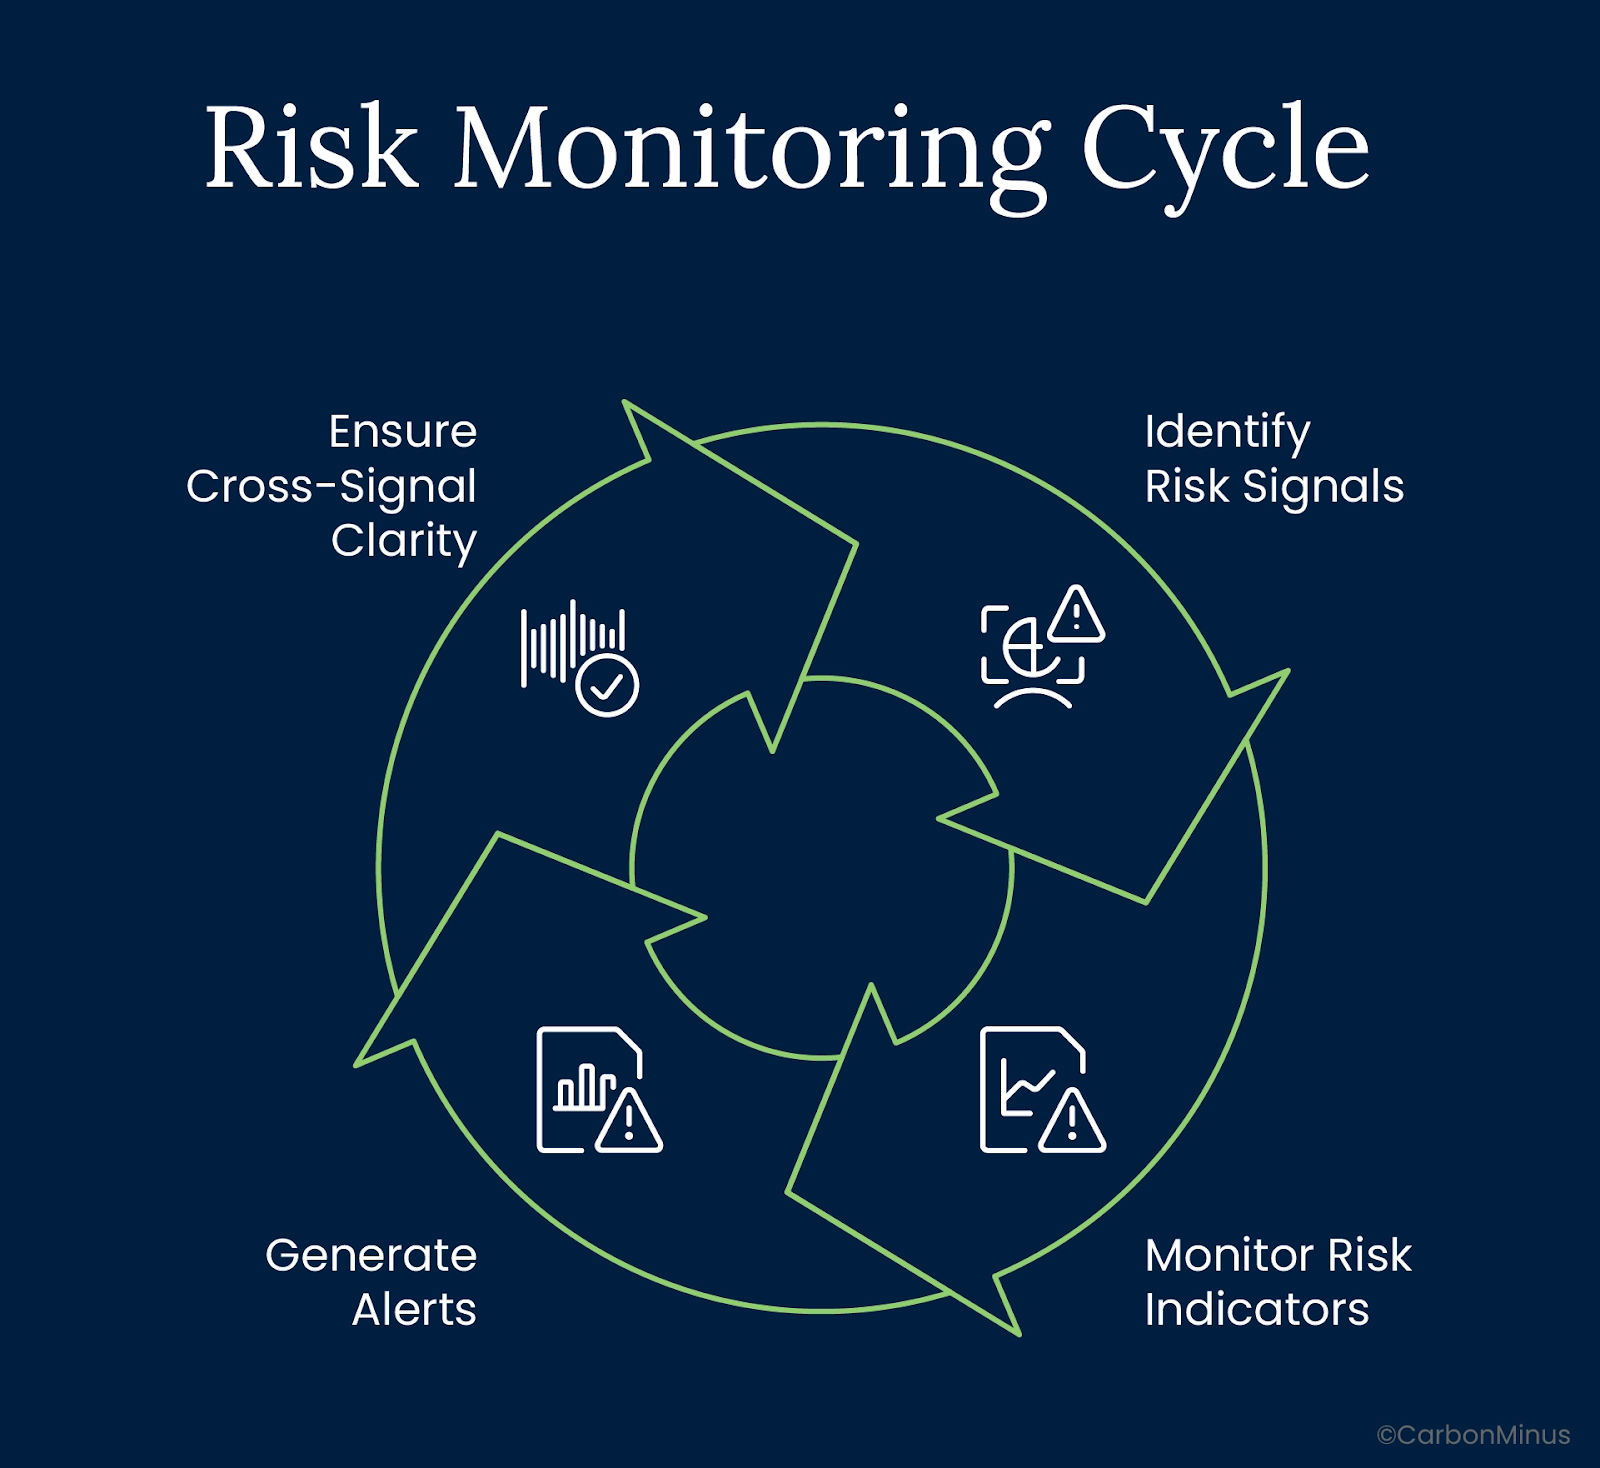
Live Monitoring of Risk Indicators
Facilities track variables like pressure, temperature, current, and flow in real time—because anomalies often show up there first.
Alerts That Leave No One Out of the Loop
When a system drifts out of its safe operating range—say, pressure climbs above set limits or vibration exceeds normal thresholds—alerts need to land with everyone who can act. That means operations, maintenance, and safety. Not just engineering.
Cross-Signal Clarity
One data point won’t tell you much. But when a fan’s temperature rises, current draw climbs, and airflow drops, all within a short window, you’ve got a real risk signal. That’s how patterns reveal problems before they escalate.
The payoff
- Spot system stress before it becomes a safety breach
- Reduce time-to-response for operational teams
- Avoid noise: fewer false alarms, more targeted action
- Stay ready for audits under OSHA, BRSR, and ISO frameworks
- This is prevention, not just efficiency. And it’s becoming the new normal.
What Should Be Standard, But Isn’t
Most plants have sensors. What they lack is alignment—and action.
These should be table stakes by now:
- Alerts linked to safe operating envelopes
Load, pressure, and temperature thresholds need to be defined and enforced. A spike outside that envelope should trigger escalation, not just log an anomaly. - Dashboards shared across Energy, Ops, and EH&S
If only one team sees the data, you’ll miss the signal. Integrated visibility isn’t optional, it’s the only way to spot cross-system failures before they compound. - Near-miss tracking that includes energy deviations
Many facilities log “what happened.” Few log “what almost did.” When you treat energy abnormalities as part of near-miss analysis, you get to the root before it becomes a risk.
Visual Snapshot: What Early Signals Look Like
| System | Precursor Signal | Risk Outcome |
| Compressor | Spike in power draw | Overheat → rupture |
| Chiller | Runtime spike + temp rise | Seal failure → leak |
| Furnace | Phase imbalance | Fire risk |
| Ventilation | Flow drop + motor lag | Fume buildup |
| Pump | Vibration + current drift | Cavitation → seal breach |
Rethinking Energy Systems as Safety Infrastructure
Most plants still treat safety systems as standalone gear. Alarms. Shutdown switches. SOP binders.
But that’s not where the signal starts.
Safety thresholds belong in your energy monitoring stack, not just your safety manual. Because electrical, thermal, and mechanical stress show up in consumption patterns before they show up in incident reports.
What this looks like in practice:
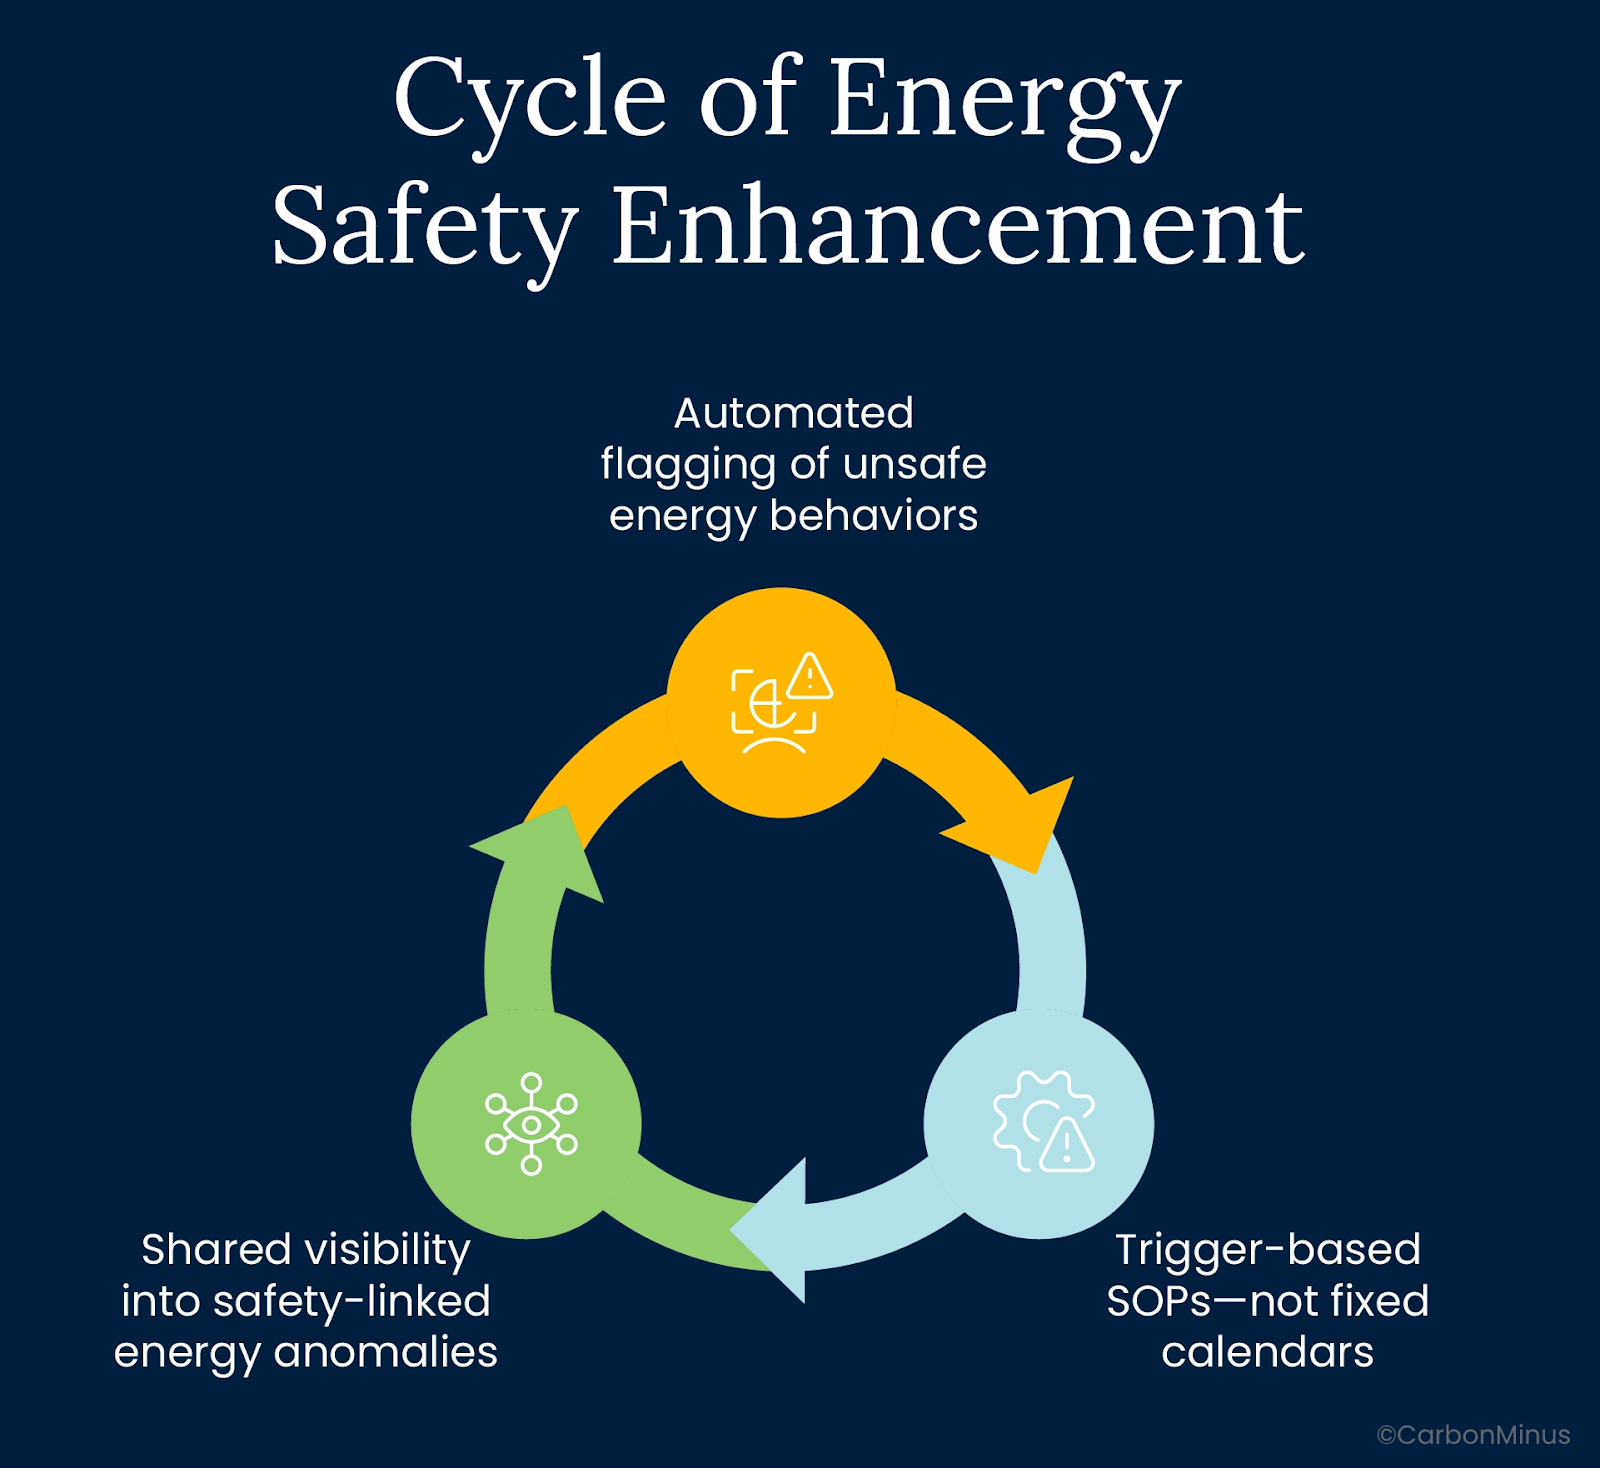
- Automated flagging of unsafe energy behaviors
If a pump draws 20% above normal with no output increase, that’s not just inefficiency, it’s a warning. And it should trigger one. - Trigger-based SOPs—not fixed calendars
Maintenance shouldn’t wait for the 90-day mark. It should respond to a deviation: torque spike, thermal drift, motor imbalance. - Shared visibility into safety-linked energy anomalies
EH&S, Ops, and Energy teams should see the same real-time deviations—with clarity on who acts, and when.
Moving from Lagging to Leading Indicators
Accidents and injuries are lagging indicators. By the time they appear, your system has already failed.
Here’s how to move upstream:
| Lagging Signal | Leading Energy Indicator |
| Fan burnout | Current rise + flow drop |
| Seal failure | Runtime spike + temp creep |
| Arc flash | Phase imbalance + vibration change |
| Heat exhaustion case | IAQ deviation + fan stall |
Safety Isn’t a Department, But a Data Layer
In the most resilient plants, safety isn’t a checklist.
It’s not confined to EH&S binders or quarterly audits.
It’s embedded in the data. In the dashboards. In the systems that never stop watching.
Because the first sign of danger isn’t smoke or alarms. It’s drift. Load spikes. Runtime anomalies.
Plants that see energy as just a cost center will keep missing those signals.
Plants that treat it as a living system, a source of foresight, will stay ahead of both risks and regulations.
The safest facilities don’t just measure risk after it happens. They track it in real time.
Energy is power. But when it’s invisible, it’s dangerous.
FAQs
How do we identify which energy signals are safety-critical?
Not every fluctuation is a threat. Start by mapping systems with high physical risk, such as steam lines, pressurized vessels, heavy motors. Then trace their energy behavior patterns (load, current, thermal drift) during near-miss events or past failures. The intersections are your priority signals.
Who should own the integration of safety and energy data?
It’s not just an engineering or EH&S problem, it’s a governance problem. Ownership often sits best with a cross-functional reliability team or a dedicated performance manager who reports jointly to Ops and Safety. Without clear accountability, integration stalls.
What kind of failures can’t be predicted by energy signals?
Failures caused by material fatigue, unexpected human error, or cyber events may not show up in energy data. That’s why energy-based safety is a leading indicator, not a complete risk model. It enhances but doesn’t replace traditional methods.
Are there industry standards for linking energy data to safety?
Not yet. ISO 45001 (safety) and ISO 50001 (energy) operate in parallel, not together. But plants are beginning to build internal SOPs that bridge this gap, especially where BRSR or CSRD reporting requires incident-prevention metrics tied to operational data.
How can we test if our current systems are creating blind spots?
Run a backcast: take a known incident or near-miss and ask, “What energy data was available before it happened?” If warning signs existed but no one saw them, you’ve got a visibility problem. That’s your proof—and your case for integration.